
$XRP Drops to $1.49 as Long Positions Stay Elevated and Support Comes Into Focus.
$XRP has pulled back sharply after its latest advance, falling from the $1.64 area toward $1.49 as short-term selling pressure returned.
CoinMarketCap currently places $XRP at approximately $1.49, down 5.64% over 24 hours, with a daily range between $1.49 and $1.65. Trading volume stands near $8.33 billion, while market capitalization is approximately $93.74 billion.
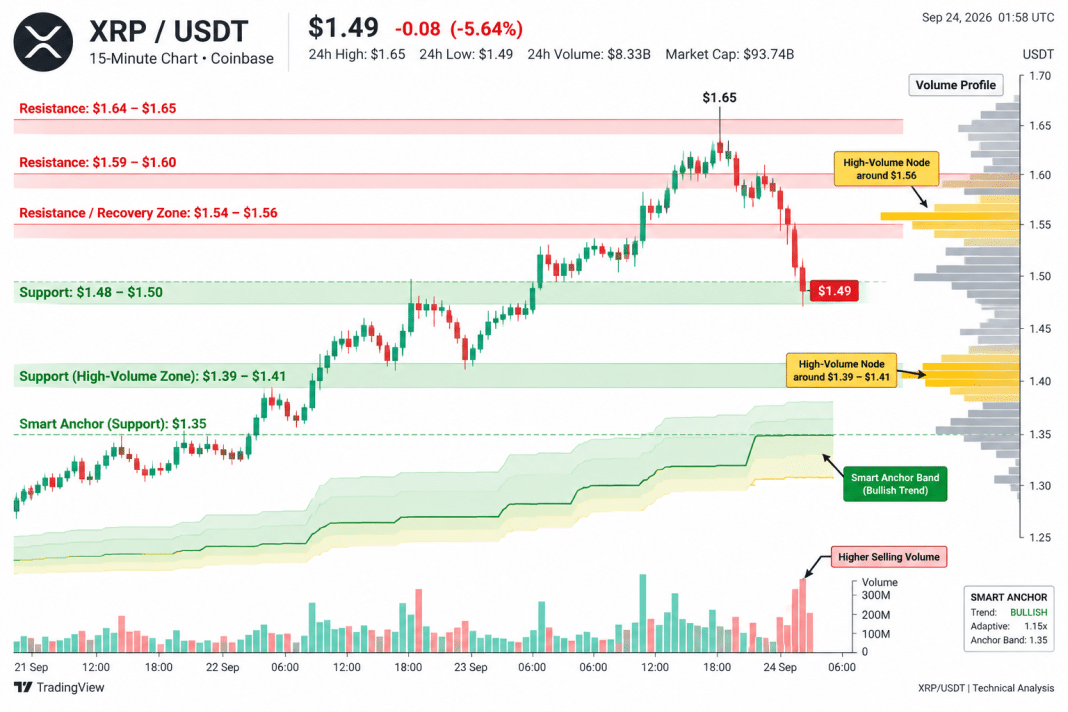
The 15-minute $XRP/USD chart shows how quickly the structure changed. $XRP advanced from roughly $1.38 on September 21, accelerated through $1.50 and $1.56, and eventually reached the $1.64–$1.65 region. That move has now been followed by a fast retracement to approximately $1.49.
$XRP Support Shifts Back Into Focus
The chart’s volume profile identifies a major high-volume region around $1.56, but $XRP has now fallen below that level. The latest decline also pushed through the $1.54 area before reaching $1.49.
Immediate support is developing around $1.48–$1.50, where the latest candle printed a lower wick after the selloff. Below this area, the chart shows another significant volume concentration around $1.39–$1.41. The indicator’s rising anchor band remains considerably lower, around $1.35, while the panel still labels the broader anchor trend as bullish.
On the upside, $1.54–$1.56 has become the first major recovery zone. Above it, the previous high-volume and price areas around $1.59–$1.60 and the recent peak near $1.64–$1.65 form the next resistance levels.
The latest five 15-minute candles show a clear shift toward sellers. Large red bodies pushed $XRP below $1.56 and $1.54, while the newest candle extended toward $1.48 before recovering to around $1.49. That lower wick shows buying response near $1.48, but the sequence remains dominated by bearish candle bodies. Volume also expanded during the decline, adding weight to the selling move.
Binance Top Traders Remain Heavily Long $XRP
The positioning chart adds another dimension to the pullback. Binance’s Top Trader Long/Short Ratio by accounts shows roughly 70% of top-trader accounts positioned long, leaving approximately 30% short in the latest four-hour observation. The accompanying long/short ratio is around 2.65, meaning long accounts substantially outnumber short accounts.
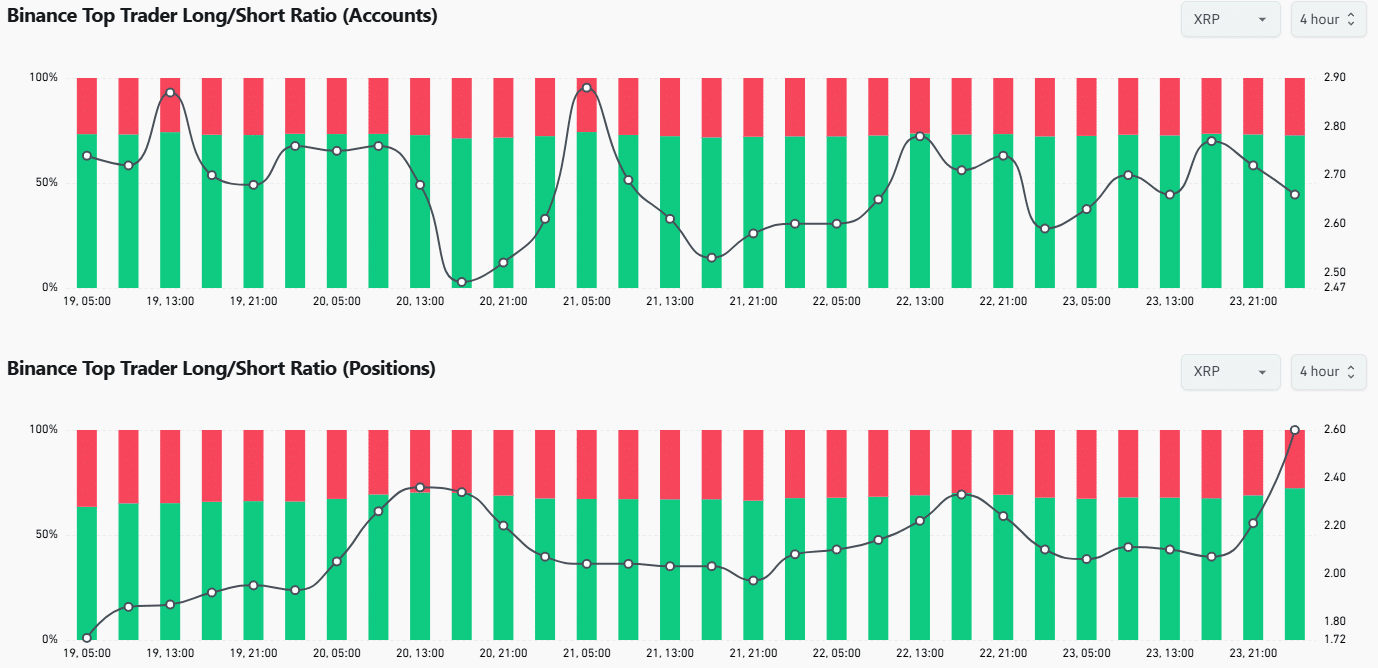
Position-based exposure is similarly concentrated. The latest Top Trader Long/Short Ratio by positions rises to approximately 2.6, with the green portion of the chart near 70% long and roughly 30% short.
That positioning is notable because $XRP has fallen toward $1.49 while top traders remain heavily tilted toward long exposure. The combination puts $1.48–$1.50 at the center of the immediate price structure. A recovery would first bring $1.54–$1.56 back into play, while further weakness would expose the larger $1.39–$1.41 support and volume zone.
The broader move remains substantial despite the pullback. CoinMarketCap’s daily data show $XRP at about $1.30 on September 17, compared with roughly $1.49 currently—leaving the token approximately 15% above that level even after the retreat from $1.65.