
Bitcoin has fallen to around $75,600 over the past 24 hours as the failed US Senate vote on the CLARITY Act, rising Treasury yields and leveraged liquidations hit the market hours before the Federal Reserve's interest rate decision.
Per CoinGecko data at press time, $BTC was trading at $75,601 down 1.3% over 24 hours and 4.3% over the past seven days.
Bitcoin had traded above $79,000 on September 15 before falling below $76,000, with the latest selling bringing the $75,000 level back into focus.
The first major drop followed the US Senate's failure to advance the Digital Asset Market Clarity Act on September 15.
The procedural vote ended 50-49 in favour, short of the 60 votes required to move the legislation forward.
Four Republican senators joined Democrats in voting against the bill, while Republican Senator Thom Tillis switched his vote for procedural reasons that could allow the measure to be reconsidered.
Bitcoin fell to an intraday low of $74,913 after the vote, according to FactSet data cited by MarketWatch.
The proposed legislation sought to establish a federal regulatory framework for digital assets and define the roles of US financial regulators.
Pressure from the bond market came at the same time. The 10-year US Treasury yield reached 5.04% on September 15, its highest level since July 2007, before easing back.
The move followed a global bond sell-off driven by higher oil prices and expectations that the Fed will raise rates.
The 10-year yield had eased to 4.97% by Wednesday as markets waited for the Fed decision, but borrowing costs remained close to their highest levels in nearly two decades.
Leveraged positions were caught in Bitcoin's fall through $77,000 and $76,000.
Liquidation estimates put total crypto liquidations over the previous 24 hours at more than $500 million, with long positions accounting for most of the losses.
The Binance $BTC/USDT 24-hour liquidation heatmap shows a dense pocket of liquidation leverage near $74,500-$74,700 below the current price.
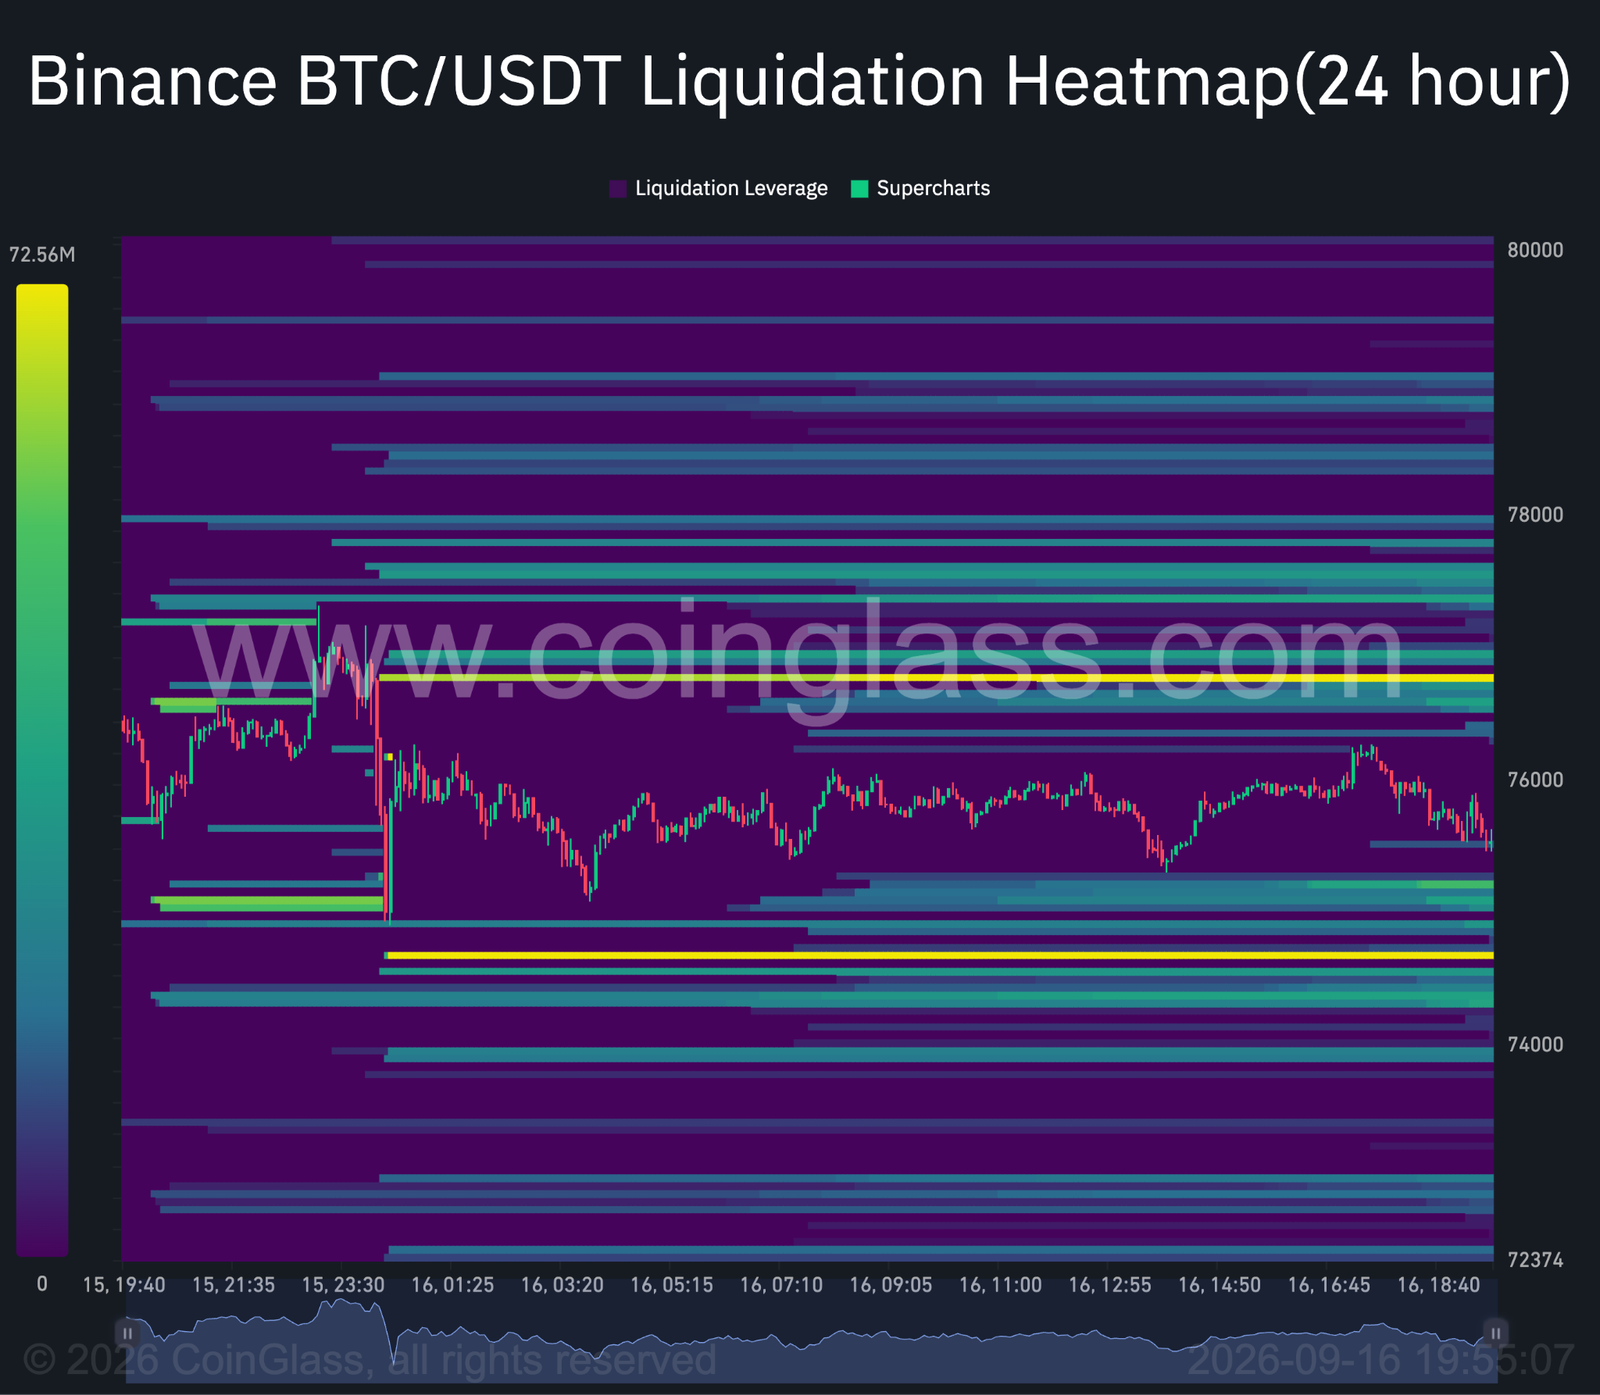
A larger concentration sits around $76,700-$77,000, leaving Bitcoin between sizeable pools of leveraged positions on either side.
US spot Bitcoin ETF flows have provided little support during the decline.
Available fund-flow estimates showed net outflows on September 15 after around $160 million of inflows in the previous session, with Fidelity's FBTC among the largest sources of withdrawals.
The next price move could come after the Federal Reserve announces its policy decision at 2 p.m. ET on September 16, followed by Chair Kevin Warsh's press conference at 2:30 p.m. ET.
The Fed's official calendar confirms both events, with the September meeting running over two days.
Markets overwhelmingly expect a 25 basis point increase, which would be the Fed's first rate hike since 2023.
Attention is likely to fall heavily on Warsh's comments because investors are trying to determine whether the expected increase will be followed by more tightening.
A quarter-point increase would take the federal funds target range from 3.50%-3.75% to 3.75%-4.00%.
The meeting includes an updated Summary of Economic Projections and dot plot, giving traders fresh information on where Fed officials expect rates to go after September.
$BTC price analysis
Bitcoin's daily chart shows price at around $75,500 after the rejection from the $80,000-$81,000 area earlier this month.
$BTC has now fallen below its 20-day exponential moving average at $76,832, putting the shortest of the four daily averages above spot price.
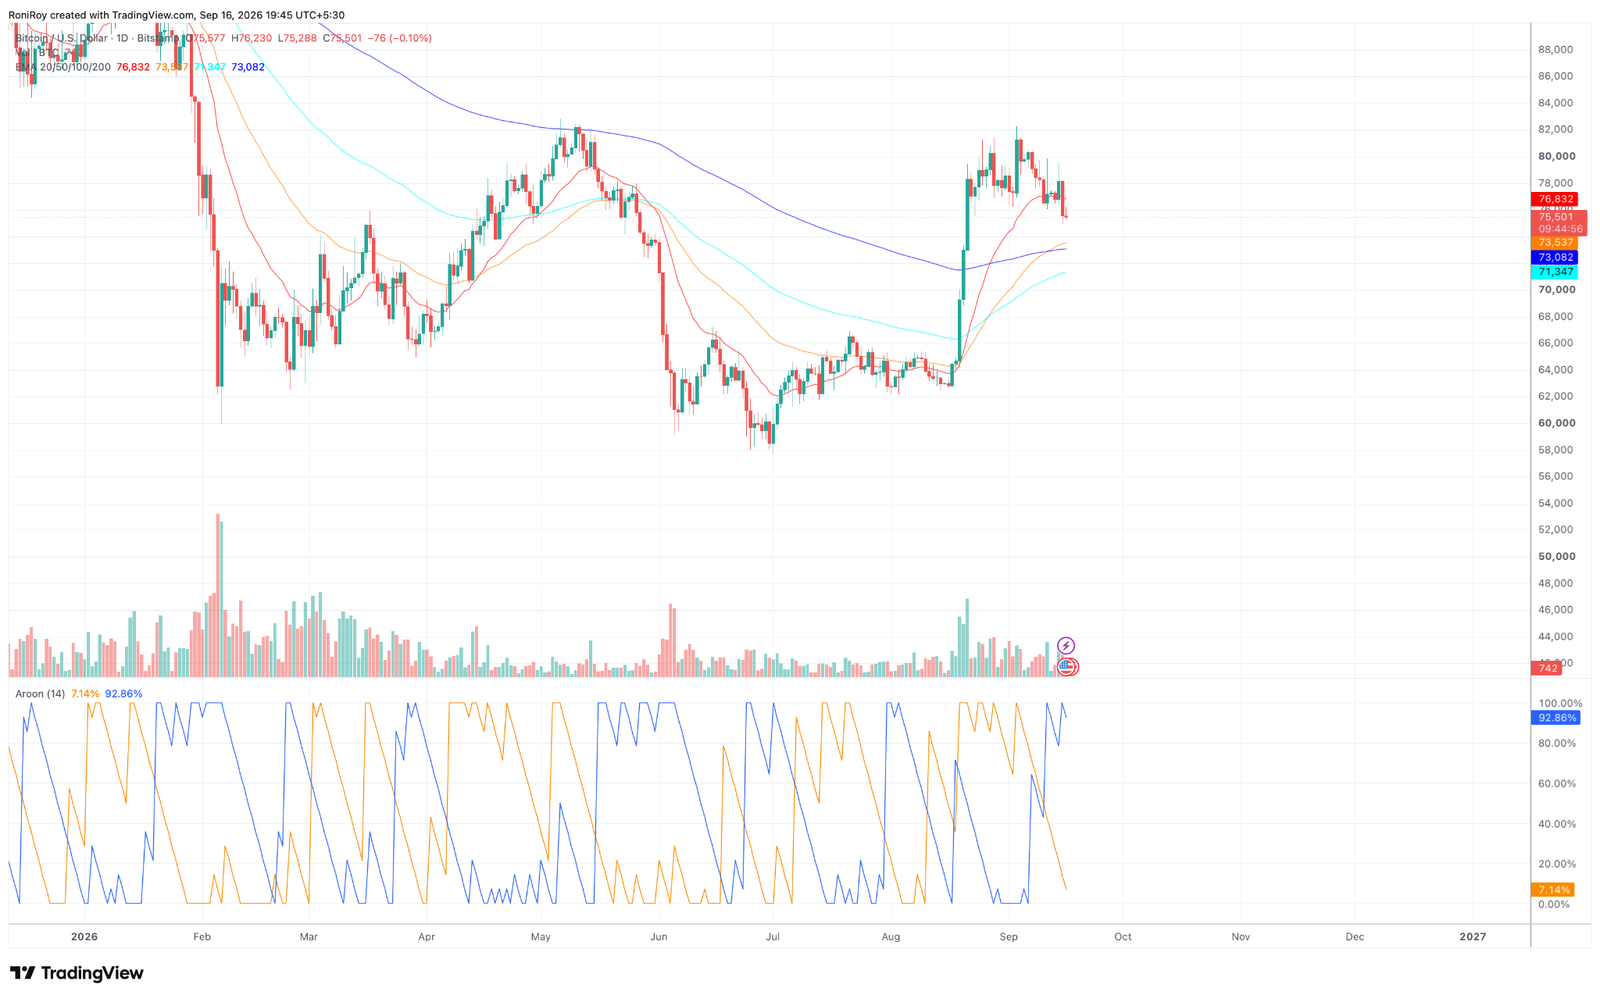
The longer averages remain below $BTC. The 50-day EMA sits at $73,537, the 100-day EMA at $71,347 and the 200-day EMA at $73,082.
The cluster between $71,300 and $73,500 gives the chart several support levels if $75,000 fails.
A daily close back above the 20-day EMA at $76,832 would put $78,000 back in play, followed by the September rejection zone around $80,000-$81,000.
$BTC would need to clear that area to break the sequence of lower highs formed since the early-September peak.
The Aroon indicator has moved sharply in favour of the downside. Aroon Down stands at 92.86%, while Aroon Up has dropped to 7.14%.
With the downside reading close to 100 and the upside line near zero, recent lows are occurring much more recently than new highs on the daily timeframe.
A break below $75,000 would first expose the $74,500-$74,700 liquidation cluster.
The 50-day and 200-day EMAs then sit close together at $73,537 and $73,082, making the $73,000-$73,500 region the next chart support.
Losing that area would expose the 100-day EMA near $71,347.
The 4-hour chart is already showing pressure below $76,000. $BTC is trading around $75,600, while the session VWAP is near $75,791.
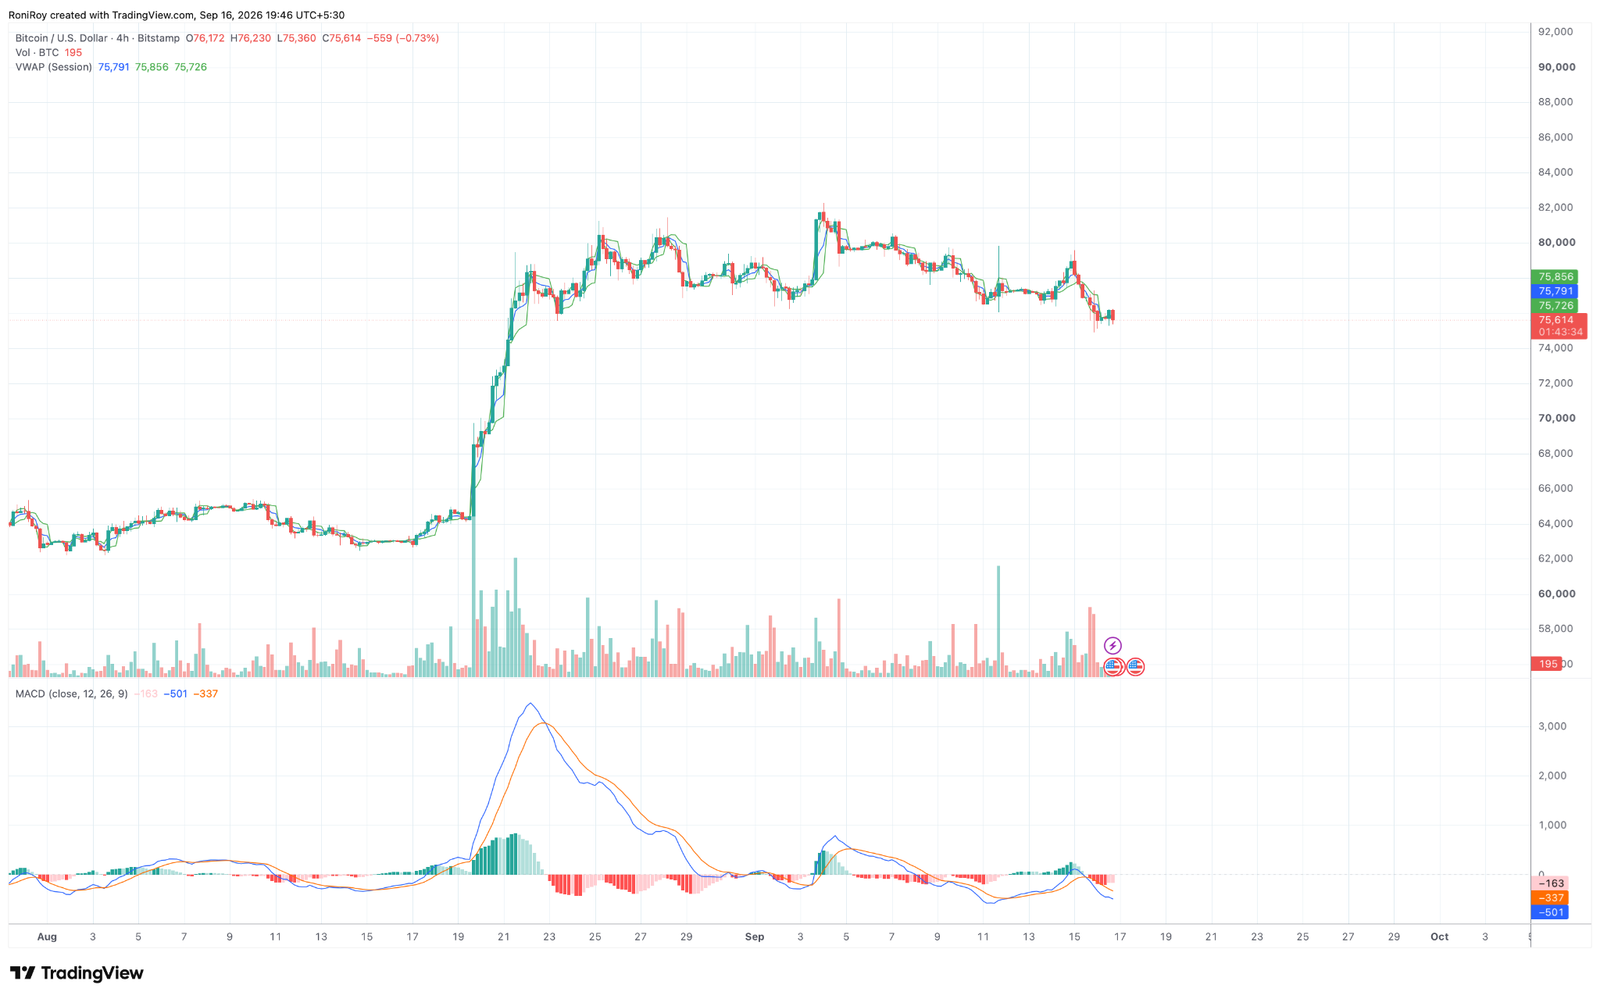
Its nearby VWAP bands sit around $75,856 and $75,726, leaving price below the central reading and close to the lower band.
A recovery above the $75,800-$76,000 area would bring the large liquidation concentration around $76,700-$77,000 into range.
Clearing that zone could open a move towards $78,000, with the daily 20-day EMA needing to be reclaimed along the way.
MACD on the 4-hour chart remains below zero. The MACD line is near -501, compared with a signal line around -337, while the histogram is around -163.
The MACD line sitting below its signal line and both readings remaining negative show that the latest decline has not yet produced a bullish momentum crossover.
$BTC therefore enters the Fed announcement sitting just above $75,000, below its daily 20-day EMA and with bearish 4-hour MACD momentum.
A break through $74,500 would put the $73,000-$73,500 EMA cluster in focus, while a recovery through $76,800-$77,000 would leave $78,000 and then $80,000-$81,000 as the next price levels to watch.
As Bitcoin heads into the Fed's rate decision near key support, traders are likely to keep a close eye on price action through top crypto exchanges.