
$XRP Prints Historic RSI Extreme as Price Tests Long-Term Rising Structure.
$XRP is trading around $1.30 on the two-week $XRP/USD chart after retreating significantly from its 2025 highs above $3. The decline has brought price back toward the lower boundary of a multi-year ascending structure while momentum has recorded an extreme reading.
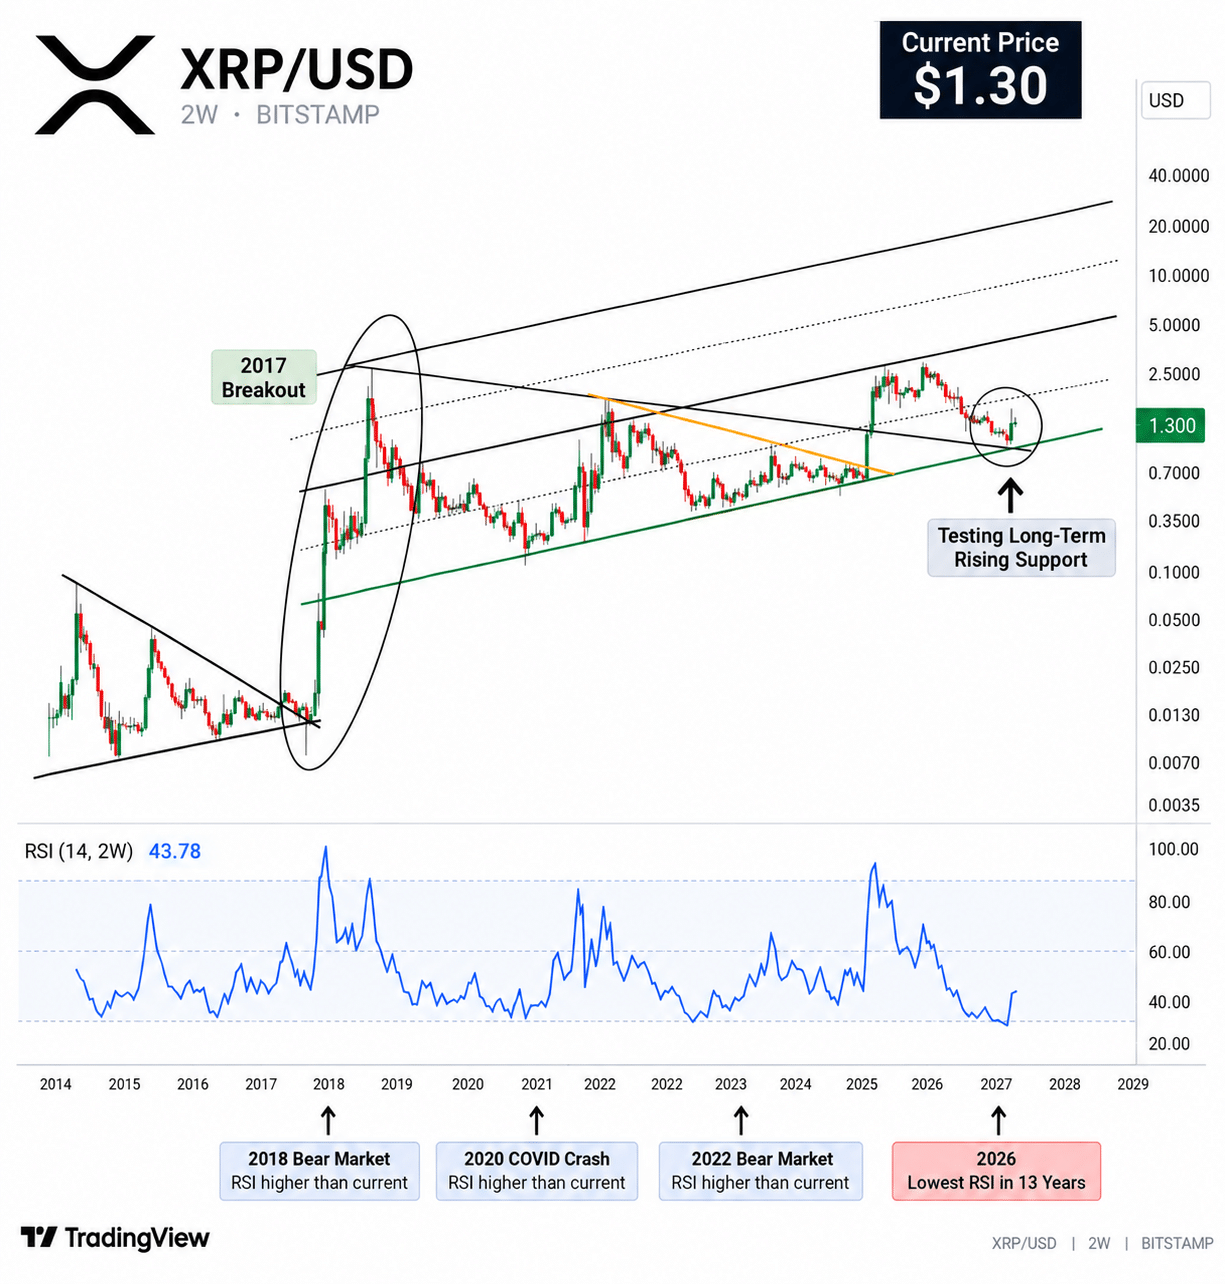
$XRP’s Two-Week RSI Hits a 13-Year Extreme
The chart marks 33.52 as the recent RSI low, the lowest level displayed across approximately 13 years of $XRP history. This reading falls below the RSI lows shown during the 2018 bear market, the March 2020 crash, and the 2022 bear market.
RSI has since rebounded to approximately 43.78, indicating that momentum has recovered from the extreme low even though $XRP remains well below its 2025 peak.
$XRP Trades Near Long-Term Rising Support
Despite the decline toward $1.30, $XRP remains positioned around a rising support trendline extending across several market cycles. The latest candles are clustered close to this lower boundary rather than near the upper portion of the long-term channel.
The chart also highlights the 2017–2018 period, when $XRP broke out from an earlier compressed structure before its major historical advance. This is a structural comparison only; the current formation and market conditions are different.
Latest $XRP Candles Show Stabilization
The latest five two-week candles show smaller bodies following the larger decline from the 2025 highs. Lower-wick activity around the recent lows indicates buying responses, while upper wicks on rebounds show that selling pressure remains present at higher prices.
Price has therefore shifted from a steep decline into a more compressed structure around the long-term trendline.
Wyckoff Structure Remains in a Testing Phase
From a Wyckoff perspective, the chart currently fits a potential re-accumulation/testing structure rather than confirmed markup. $XRP has returned to major structural support following its 2025 expansion, but the recent candles have not yet established a sustained sequence of higher highs and higher lows.
The key data shown on the chart are therefore straightforward: $XRP near $1.30, two-week RSI at 43.78 after reaching a historic 33.52 low, price near long-term rising support, and short-term candles showing compression following the 2025–2026 decline.
Together, these features show $XRP at a significant long-term structural test, with momentum recovering from its deepest RSI reading displayed on the chart.