
$ADA has fallen roughly 3% over the past 24 hours to trade near $0.204 on Sept. 15, extending its seven-day loss despite Cardano’s recent integration with the x402 payment standard.
CoinGecko puts $ADA at roughly $0.204, down more than 7% over the past week, after the token traded above $0.22 on Sept. 9 and briefly recovered towards $0.214 earlier on Monday.
The latest rebound was quickly sold, leaving the token just above the $0.20 level.
Cardano’s x402 integration has failed to reverse the decline so far.
The payment standard uses the HTTP 402 protocol to let software, including autonomous AI agents, make machine-to-machine payments without conventional accounts or checkout systems, giving Cardano developers another way to build automated payment applications.
The integration, however, does not require users or developers to immediately buy large amounts of $ADA.
Its effect on the token would depend on applications adopting x402 on Cardano, transaction activity increasing, and $ADA capturing demand generated by those applications.
Price action over the past week shows that buying has remained weak despite the announcement.
$ADA started the period above $0.22, fell towards $0.205 by Sept. 11 and spent much of the following sessions struggling below $0.21.
Monday’s rebound towards $0.214 was rejected before the token returned to roughly $0.204.
The decline extends a pattern that has developed since late August.
$ADA traded above $0.24 and briefly moved considerably higher around Aug. 22, but sellers pushed it back towards $0.20.
Another recovery in early September stalled around $0.23, leaving successive rebounds below the August peak.
Pressure across the crypto market has made those recoveries harder to sustain.
Bitcoin has slipped below the $77,000-$77,500 region while traders face uncertainty around the Federal Reserve’s policy decision and the US Senate’s CLARITY Act proceedings.
US Treasury yields have climbed as oil prices above $100 renewed inflation concerns, creating a difficult backdrop for risk assets.
$ADA’s recent derivatives positioning has created another source of pressure.
Long-heavy positioning leaves leveraged traders exposed when the spot price falls, as liquidations can force positions to close during a decline and increase short-term selling.
$ADA price analysis
$ADA’s daily chart keeps the larger downtrend intact despite its recovery from the June low near $0.145.
Price climbed as high as roughly $0.245 in August but failed to regain the large volume area around $0.245-$0.25, where the Volume Profile shows one of the strongest concentrations of historical trading activity.
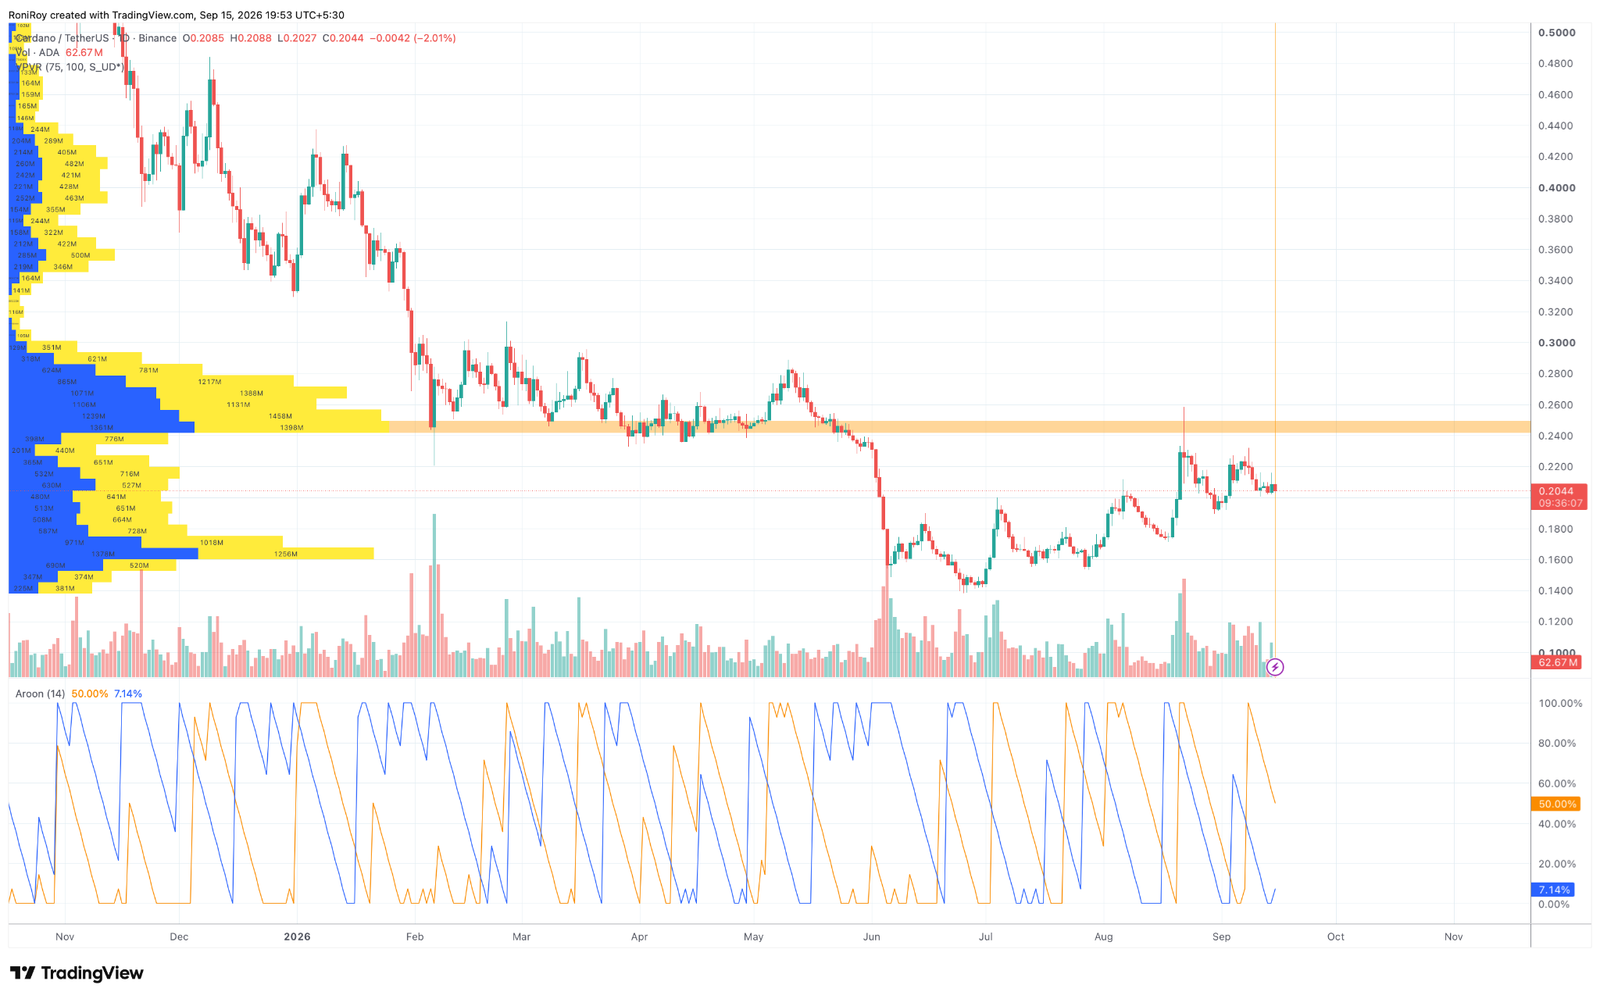
The Volume Profile places another large trading cluster around $0.17-$0.18. With $ADA now near $0.204, price is sitting between those two major volume zones.
A break below $0.20 would leave the $0.18 area as the first notable downside target, followed by the high-volume region around $0.17.
Losing that area could expose the June zone near $0.145-$0.15.
Aroon readings on the daily chart favour sellers. Aroon Down stands near 50%, while Aroon Up has dropped to roughly 7.1%.
The low Aroon Up reading shows that $ADA has not made a recent high strong enough to establish an active upward trend.
A move back above $0.22 would begin to change the recent price structure, while the larger resistance zone remains around $0.24-$0.25.
On the 4-hour chart, $ADA is trading near $0.2046 and remains below the Supertrend resistance at roughly $0.2167. See below.
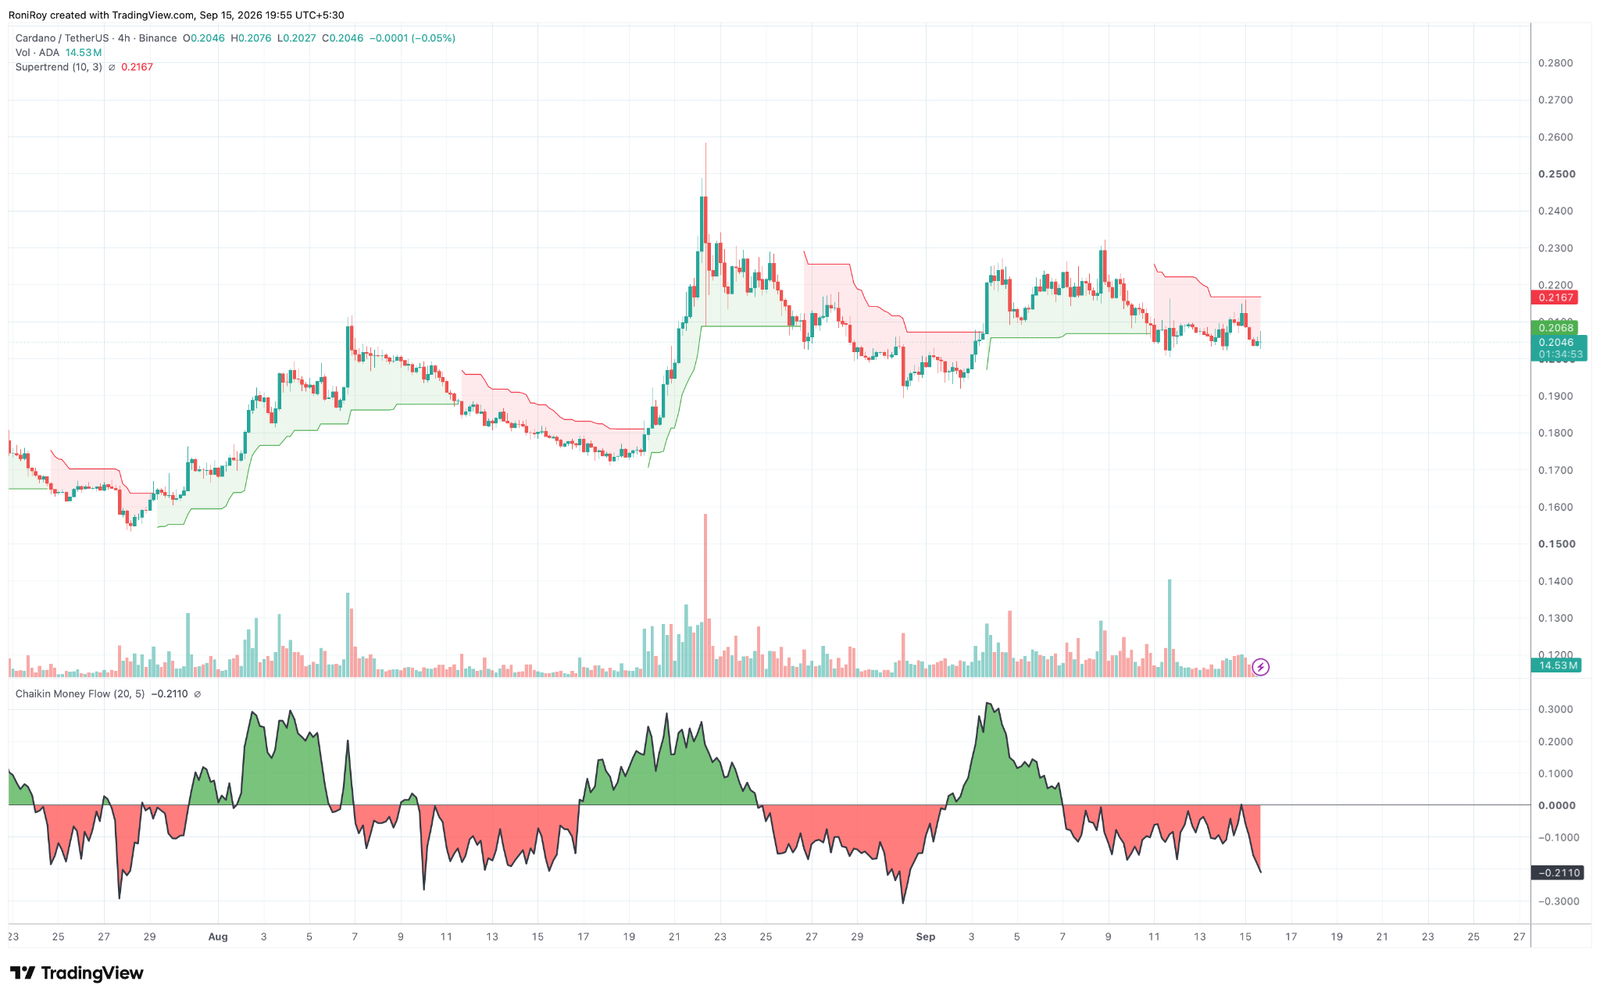
Price briefly pushed above $0.21 during the latest rebound but could not hold the move, keeping the Supertrend bearish.
$ADA would need to reclaim $0.2167 and then clear the recent $0.22-$0.23 highs before $0.24-$0.25 comes back into range.
Chaikin Money Flow has fallen to roughly -0.21 on the 4-hour chart, moving further below zero as $ADA returned towards $0.20.
The negative reading shows that selling pressure has outweighed buying pressure across the indicator’s lookback period.
A recovery above zero alongside a move through $0.2167 would provide stronger confirmation that buyers are returning.
For the downside, $0.20 remains the immediate level to watch. A clean break below it would expose roughly $0.19 before the $0.17-$0.18 volume cluster.
Holding $0.20 and reclaiming the 4-hour Supertrend near $0.2167 would instead put $0.23 in view, followed by the much stronger $0.24-$0.25 resistance area.