
Tesla stock closed at $394.06 on July 8, sitting just below key daily moving averages. The daily regime is neutral, but intraday charts reveal unresolved selling pressure. The next few sessions will determine whether the recent delivery beat can fuel a sustained recovery.
Key takeaways
- TSLA closed at $394.06, below both the EMA20 ($403.02) and EMA50 ($403.51).
- Daily RSI at 47.12 signals neutral momentum with no bullish conviction.
- RBC raised its Tesla price target to $500 from $475, implying roughly 24% upside.
- The hourly chart shows explicitly bearish EMA alignment, with price below all three key moving averages.
- A close above $403 or a breakdown below $389 would likely define the next directional move.
Tesla Stock Daily Bias: Neutral With a Bearish Undertow
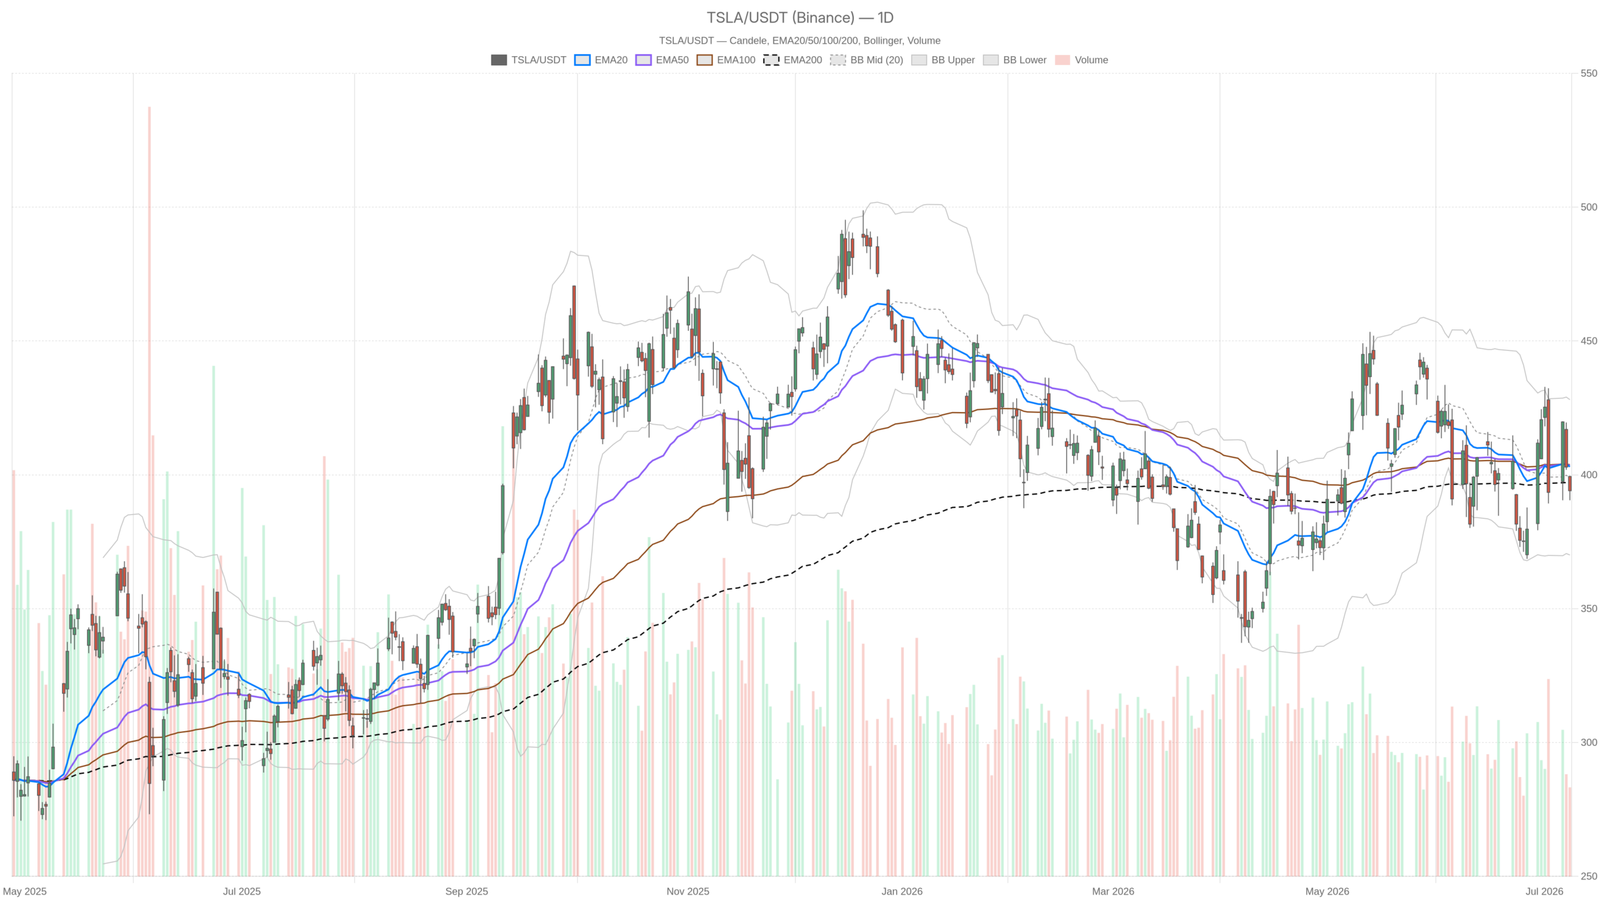
The daily bias for Tesla stock is neutral, but the moving average structure tilts bearish. TSLA trades below both the EMA20 at $403.02 and the EMA50 at $403.51. That alone places price in a structurally weak position relative to short- and medium-term momentum. Notably, however, the EMA200 sits at $397.07 — only slightly above current price. This proximity keeps the long-term picture from turning outright bearish.
Meanwhile, the daily RSI at 47.12 reflects a market sitting in no-man’s land. It is not oversold, but it carries no bullish conviction either. The daily MACD tells a more nuanced story. The line at -0.94 remains in negative territory. Yet the histogram has flipped positive at 0.96 — a nascent sign of momentum recovery off recent lows. It is not a buy signal. It is a warning that selling momentum may be losing steam.
Bollinger Bands on the daily chart place price well within the range. The midline at $399.07 acts as immediate overhead resistance. The upper band at $428.09 and lower band at $370.06 define the current volatility envelope. With an ATR14 of $20.36, daily swings remain wide. Positioning without defined levels carries meaningful risk.
Daily pivot analysis places support at $389.84 and resistance at $398.96. TSLA closed near its pivot point of $394.73, suggesting equilibrium — but also indecision.
Hourly Signals Confirm Bearish Pressure
The hourly chart confirms what the daily only hints at: selling pressure is real and unresolved. The 1-hour timeframe shows an explicitly bearish regime. Price at $393.87 trades below all three key EMAs — the EMA20 at $400.67, EMA50 at $402.69, and EMA200 at $403.78. That stacked bearish alignment represents meaningful short-term distribution.
In contrast to the daily picture, the 1H RSI at 39.28 is approaching oversold territory without quite reaching it. That level can precede either a bounce or a continuation leg lower. Context will determine which. The 1H MACD remains firmly negative. The histogram reads -1.48, with both line and signal still deep in negative territory. There is no intraday momentum recovery in sight yet.
On the other hand, the hourly Bollinger Band structure shows price closer to the lower band at $385.69. The midline at $404.81 sits far above. That distance confirms extended selling. A mean-reversion attempt toward $400–$404 is plausible. However, it would require a catalyst — or at minimum, a pause in selling.
Hourly pivot support sits at $392.37, with resistance capped at $395.72. TSLA is effectively boxed into a narrow intraday range. This compression sets the stage for a potential directional move.
15-Minute Execution Context
The 15-minute frame reinforces the bearish regime. However, it offers one subtle signal worth watching. The MACD histogram on the 15m has turned slightly positive at 0.61, even as the line remains negative. This mirrors the pattern seen on the daily chart — a very early hint that short-term selling pressure may be moderating.
The RSI at 44.41 is neutral-to-weak. EMA structure remains bearish, with price below the EMA50 at $398.44 and EMA200 at $402.76. Therefore, this timeframe is best used for entry timing rather than directional thesis-building.
Bullish Catalysts Behind Tesla Stock
Still, the fundamental narrative for Tesla stock has seen meaningful positive inputs recently. Better-than-expected deliveries are reinforcing the investment case. The robotaxi launch in Miami has kept the longer-term growth story alive. RBC raised its price target to $500 from $475. This implies roughly 24% upside from current levels. It signals that institutional bulls remain engaged even as price struggles near $394.
Additionally, Wall Street’s warm reception for SpaceX has spilled over into Tesla, given the perceived association between the two entities. JPMorgan noted that a potential Tesla-SpaceX merger looks “coherent on paper.” However, China approval risks remain a significant overhang. That nuance is important: the bullish narrative exists, but it is not without execution risk.
Technically, a bullish scenario would require TSLA to reclaim the EMA200 near $397. Price would then need to push decisively above the $399–$403 zone. This is where the EMA20 and EMA50 converge. A daily close above $403 would represent a meaningful structural shift. It could open a path toward the Bollinger midline at $428 over time.
Bearish Risks That Could Keep Pressure on Tesla Stock
However, the bearish case is more immediately visible in the technicals. If TSLA fails to reclaim the $397 EMA200 support zone, bearish pressure could intensify. The hourly RSI continues deteriorating toward oversold without a reversal. The next meaningful support sits at the daily S1 of $389.84. Below that, the lower Bollinger Band at $370.06 comes into play.
The robotaxi rollout timeline remains a source of uncertainty. One news source explicitly noted that investors will need to be patient. Patience is not what drives short-term momentum. Meanwhile, China approval risks flagged around the SpaceX-Tesla narrative add geopolitical complexity. If macro sentiment shifts and these risks crystallize, the stock’s proximity to key support could quickly become a liability.
Overall, the invalidation of the bullish case is straightforward. A break and sustained close below $389 would shift the daily structure from neutral to bearish. This would likely trigger further unwinding.
Positioning and Volatility Outlook
For now, Tesla stock sits in a technically ambiguous position. The daily regime is neutral, but the intraday structure leans bearish. The fundamental narrative offers genuine catalysts — delivery outperformance, robotaxi expansion, and strong institutional price targets. Yet the chart has not confirmed any of that optimism.
At the same time, daily MACD histogram improvement and the 15-minute MACD hint that selling pressure may be decelerating. With an ATR of over $20 on the daily, volatility remains elevated. Traders should respect defined levels rather than chasing direction. The next clear signal will likely come from either a reclaim of $403 or a breakdown below $390. Until one of those happens, TSLA remains a stock in search of a verdict.
FAQ
What is the current technical outlook for Tesla stock?
Tesla stock is in a neutral daily regime with bearish intraday undertones. TSLA closed at $394.06 on July 8, below both the EMA20 at $403.02 and EMA50 at $403.51. The hourly chart shows explicitly bearish structure, with price below all three key EMAs and the 1H RSI at 39.28 approaching oversold territory.
What are the key support and resistance levels for TSLA right now?
Key support sits at $389.84 (daily S1), with the lower Bollinger Band at $370.06 serving as a deeper floor. Resistance is at $398.96 (daily R1), with the critical $399–$403 zone — where the EMA20 and EMA50 converge — acting as the main overhead barrier. A daily close above $403 would mark a structural shift.
What is driving the bullish case for Tesla stock?
Better-than-expected deliveries and the robotaxi launch in Miami support the bullish narrative. RBC raised its price target to $500 from $475, implying roughly 24% upside. JPMorgan noted a potential Tesla-SpaceX merger looks “coherent on paper.” Technically, bulls need TSLA to reclaim the EMA200 near $397 and push above $403.
What would invalidate the bullish outlook?
A break and sustained close below $389 would shift the daily structure from neutral to bearish. If the hourly RSI continues deteriorating toward oversold without reversing, and if China approval risks or robotaxi timeline uncertainty weigh on sentiment, the bearish scenario would likely accelerate.
Disclaimer: This article is for informational purposes only and does not constitute financial advice, an investment recommendation, or a solicitation to buy or sell any financial instrument or cryptocurrency. The analysis provided is not indicative of future results. Investing in crypto assets and financial markets carries a high risk of capital loss. Always do your own research (DYOR) and consult a qualified financial advisor before making any decision.
Article produced with the assistance of artificial intelligence and reviewed by the editorial team.