
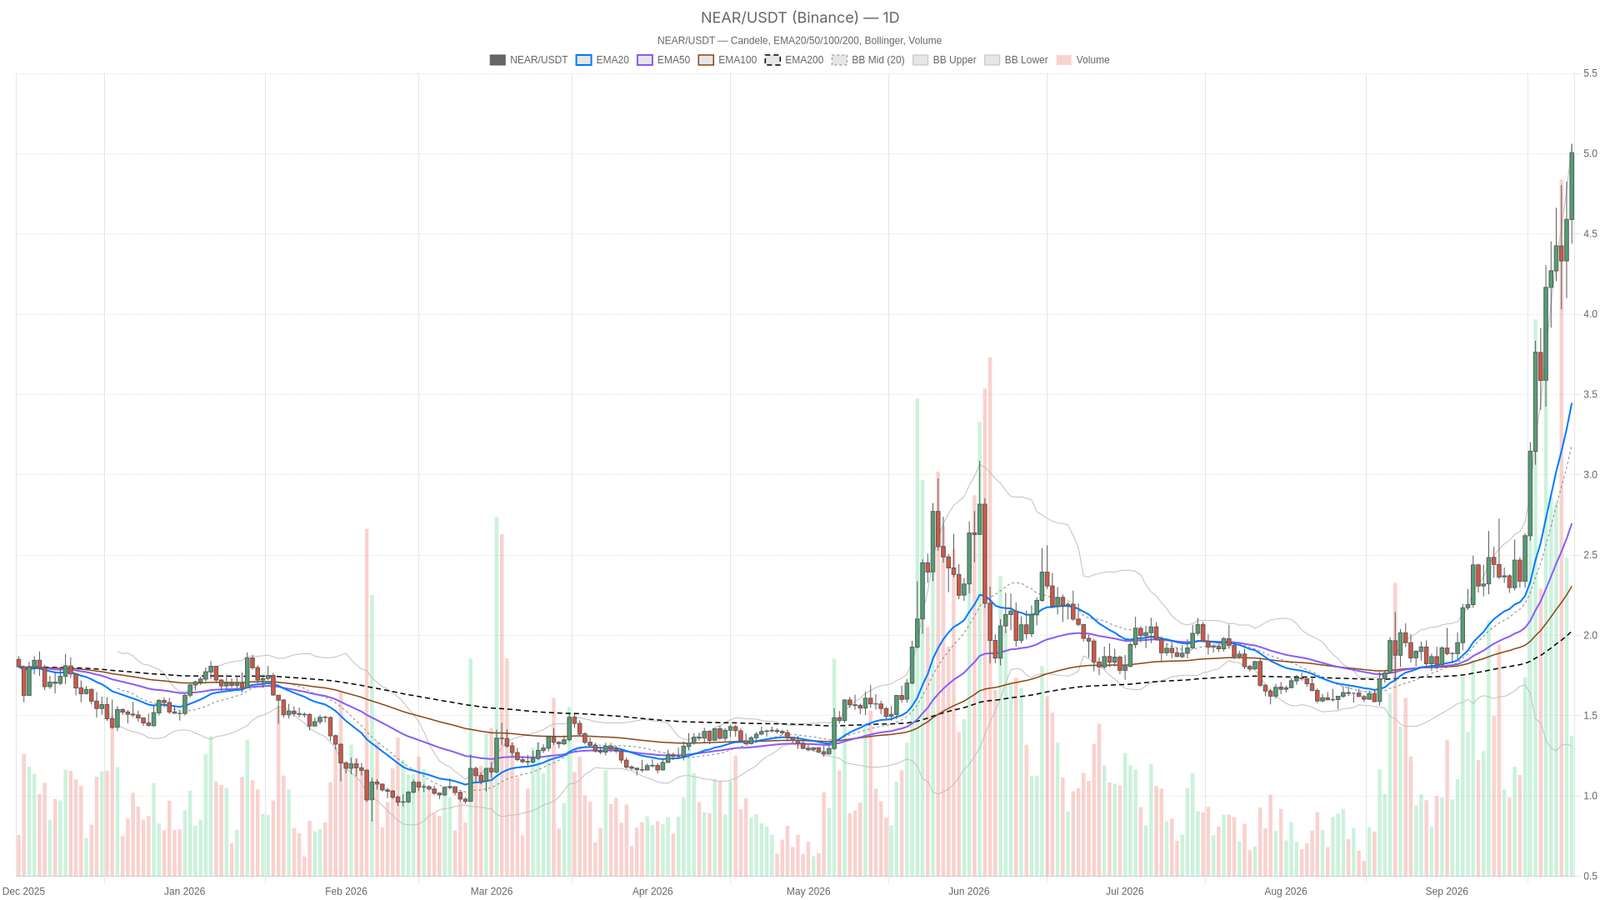
As of September 25, 2026, the Near crypto token trades at $5.01 on the daily chart, sitting almost exactly on the upper Bollinger Band with a 14-period RSI of 84.86 — a reading that signals overextension even as the broader uptrend remains unambiguously intact.
Key takeaways
- $NEAR sits at $5.01 with a daily RSI of 84.86, pressed against the upper Bollinger Band at 5.06.
- The EMA stack across daily, hourly, and 15-minute timeframes confirms a textbook bullish alignment.
- Total crypto market capitalization stands near $2.88 trillion, down 1.35% over 24 hours, while Bitcoin dominance holds at 58.8%.
- $NEAR ecosystem fee data shows sharp week-over-week declines of 42% to 80% across tracked protocols.
- The daily pivot at 4.84 and S1 at 4.61 serve as the first tells; a clean break above R1 at 5.23 signals continued buyer control.
The Daily Trend: Structure Still Points Up, But It’s Stretched
On the daily timeframe, the regime is tagged bullish and the EMA stack backs that up cleanly: the 20-period EMA at 3.45 sits above the 50-period at 2.70, which sits above the 200-period at 2.03. That is a textbook uptrend alignment, meaning the Near crypto structure remains constructive even at these levels. Pullbacks toward these averages would, in a healthy scenario, be buying opportunities rather than trend breaks.
However, the problem is how far price has run relative to that structure. The close at $5.01 is nearly 45% above the 20-EMA and well over double the 200-EMA. Meanwhile, an RSI of 84.86 sits deep in territory usually associated with exhaustion rather than fresh initiation. The MACD line at 0.69 versus a signal of 0.50, with a histogram of +0.19, confirms upward momentum is still technically positive and expanding. That said, momentum indicators like this tend to lag — they keep printing bullish readings even as the underlying move loses steam.
Bollinger Bands tell the same story from a volatility angle: the mid-band sits at 3.19, the upper band at 5.06, and price parked right at 5.01 means $NEAR is essentially riding the outer edge of its own volatility envelope. Moreover, ATR14 on the daily sits at 0.50, roughly 10% of the current price — a genuinely wide range. Daily pivot math puts the pivot point at 4.84, with resistance R1 at 5.23 and support S1 at 4.61. Price trading above the pivot keeps the near-term bias tilted bullish, but the gap down to the 20-EMA at 3.45 is a reminder of how much room exists for a correction before the broader uptrend would even be threatened.
1H Confirmation: Momentum Is Real, But It’s Thinning
The 1-hour chart still reads bullish, with EMA20 at 4.65, EM50 at 4.53, and EMA200 at 3.99 all stacked in the right order. That said, the RSI has cooled slightly to 73.67 from the daily’s 84.86, and the MACD histogram has thinned to just 0.04, with the line at0.10 and signal at 0.06. Momentum is positive but clearly decelerating on this timeframe. Bollinger Bands on the 1H show price at 5.00 pressing against the upper band at4.95 — another sign of a market that is technically overbought on a shorter horizon too.
The 1H pivot cluster is unusually tight: pivot at5.01, R1 at 5.05, and S1 at4.95. This means price is essentially balanced right on top of its own reference point. ATR14 here is just 0.12, a fraction of the daily range, confirming that the big volatility expansion happened on the higher timeframe while the hourly chart now consolidates within it.
15-Minute Execution Context
Zooming into the 15-minute chart, the bullish regime holds once more, with EMA20 at 4.85 above EMA50 at4.71 above EMA200 at 4.55. RSI sits at 70.42 — still overbought but the least extreme of the three timeframes. The MACD histogram is barely positive at0.02, suggesting momentum on this granular level is close to flat. Bollinger Bands show room between price at 5.00 and the upper band at 5.22, meaning there is technically some short-term space to extend before hitting the same kind of ceiling visible on the daily and hourly charts. The tight 15-minute pivot range, with the pivot at5.00, R1 at 5.02, and S1 at4.98, is best read as noise for execution timing rather than a directional signal in its own right.
Market Backdrop: Dominance, Sentiment, and Ecosystem Flows
Bitcoin dominance near 58.8% alongside a 24-hour dip of 1.35% in total market cap suggests capital is not broadly flooding into altcoins right now. The tape looks mildly risk-off at the index level even while the Fear & Greed Index reads 71, firmly in Greed territory. That combination matters for how sustainable $NEAR’s move is: strength that persists despite a cooling macro backdrop is more impressive, but it also means there is less of a rising tide to lift the boat if sentiment turns.
On-chain activity data from DefiLlama on the Near ecosystem adds useful color. $NEAR Intents, categorized as a Bridge protocol, shows fees down 18.24% on the day and down 42.05% over seven days, though still up 21.13% over the past 30 days. Rhea Dex tells an even more pronounced version of the same story: fees down 31.43% daily and a steep 73.82% over seven days, with 30-day fees only marginally positive at +3.03%. THORSwap fees dropped 10.27% daily and 80.38% over the week, while 30-day fees remain up 24.47%. Taken together, this points to an ecosystem where transactional and DEX activity spiked meaningfully over the past month but has decelerated hard in the past week — a flow pattern that often precedes or coincides with exactly the kind of overbought price stall visible on the charts above.
Bullish Scenario
If $NEAR holds above the daily pivot at 4.84 and pushes through R1 at5.23, the bullish case stays intact. EMA alignment across all three timeframes remains constructive, MACD histograms are still positive even if thinning, and a break of the upper Bollinger Band on the daily at5.06 with conviction could open a genuine breakout leg rather than a fakeout. For this scenario to have legs, buyers would need to keep absorbing the RSI overextension without a meaningful pullback — essentially proving the trend is strong enough to digest overbought conditions through time rather than through price correction. A reacceleration in $NEAR Intents or Rhea Dex fee growth would help validate that renewed demand is showing up on-chain, not just on the price chart.
Bearish Scenario
In contrast, the bearish case centers on exactly what the RSI and Bollinger Band positioning are flagging: a daily RSI near 85 sitting right at the upper band is a fragile technical posture. A break below the daily pivot at4.84 followed by a slip through S1 at4.61 would be the first sign that momentum is failing. The 20-EMA at 3.45 then becomes the more meaningful downside magnet if the correction extends. A move of that size would still leave the broader daily uptrend technically alive, given the 50- and 200-EMAs sit even lower, but it would represent a sharp double-digit percentage pullback from current levels. The steep week-over-week decline in ecosystem fees, down 42% to 80% across tracked protocols, adds a fundamental caution flag: if on-chain usage keeps cooling while price stays elevated, that divergence is often resolved by price catching down rather than activity catching up.
Where This Leaves Traders
Ultimately, $NEAR right now is a study in trend versus extension. The daily and hourly structures both confirm an uptrend that has earned its bullish label, but the RSI readings across all three timeframes — 84.86, 73.67, and 70.42 — leave very little room for complacency about how stretched this move has become. Volatility is elevated, with daily ATR near 10% of price. The broader market cap is drifting lower even as Fear & Greed sits in outright Greed territory, and ecosystem fee data shows a sharp deceleration in activity after a strong prior month. None of that automatically means a top is in, but it does mean the risk of a fast pullback is meaningfully higher than when this trend started. Anyone tracking this setup should watch the daily pivot at 4.84 and S1 at4.61 as the first real tells, while treating a clean break above R1 at5.23 as the signal that buyers remain firmly in control.
FAQ
Is $NEAR overbought at current levels?
Yes, across all three timeframes. The daily RSI reads 84.86, the 1-hour RSI sits at73.67, and the 15-minute RSI is at 70.42. All three are above the 70 threshold, and the daily reading near85 is deep in territory historically associated with exhaustion. Additionally, price is pressed against the upper Bollinger Band on both the daily and hourly charts, reinforcing the overextended signal.
What are the key support levels to watch?
The first line of defense is the daily pivot at 4.84, followed by S1 at4.61. Below that, the 20-period EMA at 3.45 represents the more significant structural support — a level that would need to break before the broader uptrend comes into question, since the 50-EMA at2.70 and 200-EMA at 2.03 sit even lower.
What does the decline in $NEAR ecosystem fees signal?
Fees across $NEAR Intents, Rhea Dex, and THORSwap have dropped sharply over the past week, with declines ranging from 42% to 80%. This suggests that on-chain transactional and trading activity is cooling after a strong prior month. When price stays elevated while usage declines, the divergence can foreshadow a correction, though it does not guarantee one.
Can the bullish trend continue despite overbought readings?
Yes, it can. Strong trends can digest overbought conditions through time rather than price — meaning the asset consolidates sideways while moving averages catch up, rather than dropping sharply. A clean break above R1 at5.23 would signal that buyers are absorbing the overextension and that the trend has further room to run.
Disclaimer: This article is for informational purposes only and does not constitute financial advice, an investment recommendation, or a solicitation to buy or sell any financial instrument or cryptocurrency. The analysis provided is not indicative of future results. Investing in crypto assets and financial markets carries a high risk of capital loss. Always do your own research (DYOR) and consult a qualified financial advisor before making any decision.
Article produced with the assistance of artificial intelligence and reviewed by the editorial team.