- Hyperliquid generated $429.04 million through September 15, leading CoinGecko’s 2026 crypto revenue ranking.
- Current DeFiLlama data put Hyperliquid’s annualized revenue near $696 million against roughly $7 billion in TVL.
- Bitcoin’s break above $85,000 triggered a heavily one-sided derivatives reset, with shorts accounting for 84% of 24-hour liquidations.
Hyperliquid has taken the top position in CoinGecko’s 2026 crypto revenue ranking, but the more revealing numbers sit beneath the headline figure.
The perpetual futures platform generated $429.04 million from January 1 through September 15, ahead of Pump.fun at $322.21 million. CoinGecko’s methodology excludes Tether and Circle because their scale would distort the comparison, while Grayscale is removed because its revenue comes from AUM-based sponsor fees rather than protocol usage.
Current DeFiLlama data provide another way to measure Hyperliquid’s economics. The protocol holds about $7.04 billion in TVL, generated $65.33 million in revenue over the past 30 days and processed roughly $240.17 billion in perpetual volume during the same period. DeFiLlama puts annualized revenue at approximately $696 million.
Those figures allow Hyperliquid to be evaluated on something more useful than a revenue leaderboard.
Hyperliquid Generates About $9.30 Monthly Revenue Per $1,000 in TVL
Using DeFiLlama’s current $7.04 billion TVL and $65.33 million in 30-day revenue, Hyperliquid generated revenue equivalent to approximately 0.93% of TVL in one month.
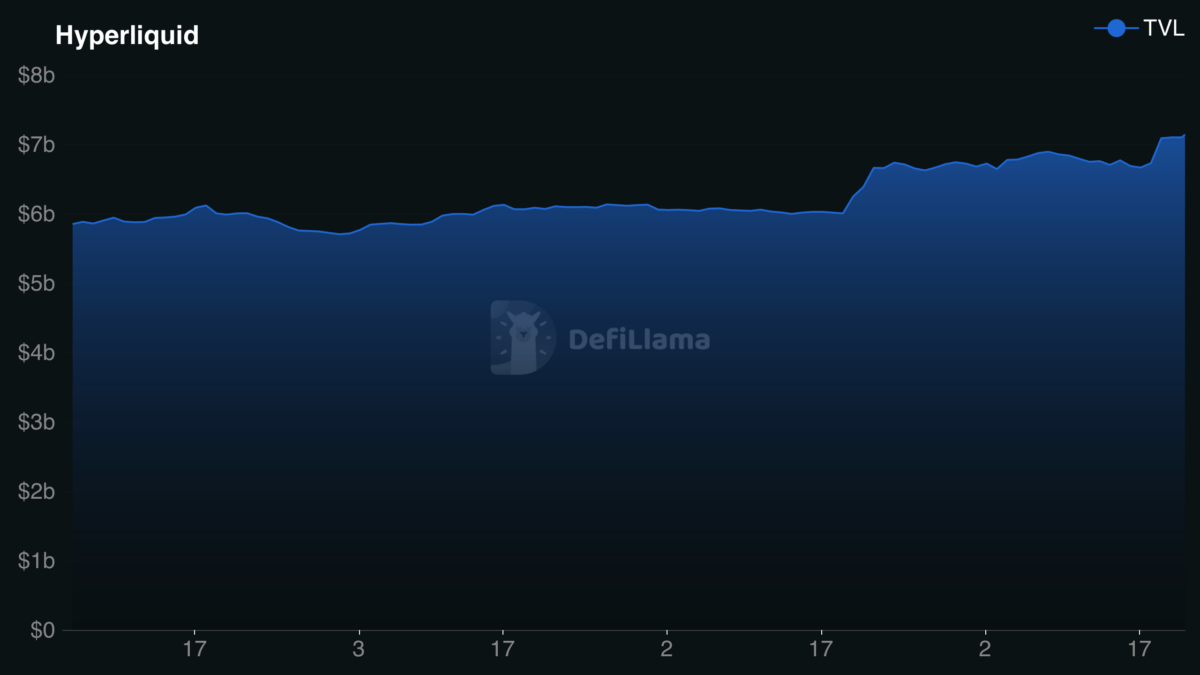
Put differently, every $1,000 of value locked corresponded to roughly $9.30 in protocol revenue over the latest 30 days.
That is not an investment yield for depositors or $HYPE holders. It is a simple capital-efficiency ratio showing how much protocol revenue is being produced relative to capital sitting within the ecosystem.
Trading volume shows an even larger difference in scale.
Hyperliquid processed around $240.17 billion in perpetual volume over 30 days, equivalent to roughly 34 times its current TVL. Revenue represented approximately 0.027% of that notional volume, or about $272 for every $1 million traded.
The calculations help explain why perpetual exchanges can generate substantial revenue without requiring TVL to grow at the same rate as trading activity. Capital can be repeatedly reused as positions are opened, closed and adjusted.
DeFiLlama currently shows $7.14 billion in open interest as well, roughly equal to Hyperliquid’s combined TVL.
Trading Businesses Dominate the Revenue Ranking
Hyperliquid is not an isolated case in CoinGecko’s dataset.
Pump.fun generated $322.21 million, Axiom Pro $132.09 million and GMGN $126.03 million. Polymarket contributed another $115.48 million, while perpetual exchange edgeX generated $84.37 million.
Together with Hyperliquid, those six trading or trading-adjacent businesses generated about $1.21 billion.
That is roughly 75% of the $1.61 billion produced by the top 10 projects.
The comparison requires some caution. CoinGecko explicitly notes that the categories are a best-effort classification rather than a formal taxonomy. It also includes businesses such as Paxos and World Liberty Financial whose revenue can come largely from interest earned on reserves rather than transaction fees.
Hyperliquid’s revenue is more closely connected to trading activity.
Its own composition reinforces that point. DeFiLlama records $137 million of perpetual fees in Q3 to date, compared with $3.77 million from spot trading. Builder-code fees contributed another $18.47 million.
Perpetuals therefore remain the central economic engine rather than one product among several equally important businesses.
Bitcoin Breakout Puts the Model Under Stress
The September 21 market provides a useful live test of that model.
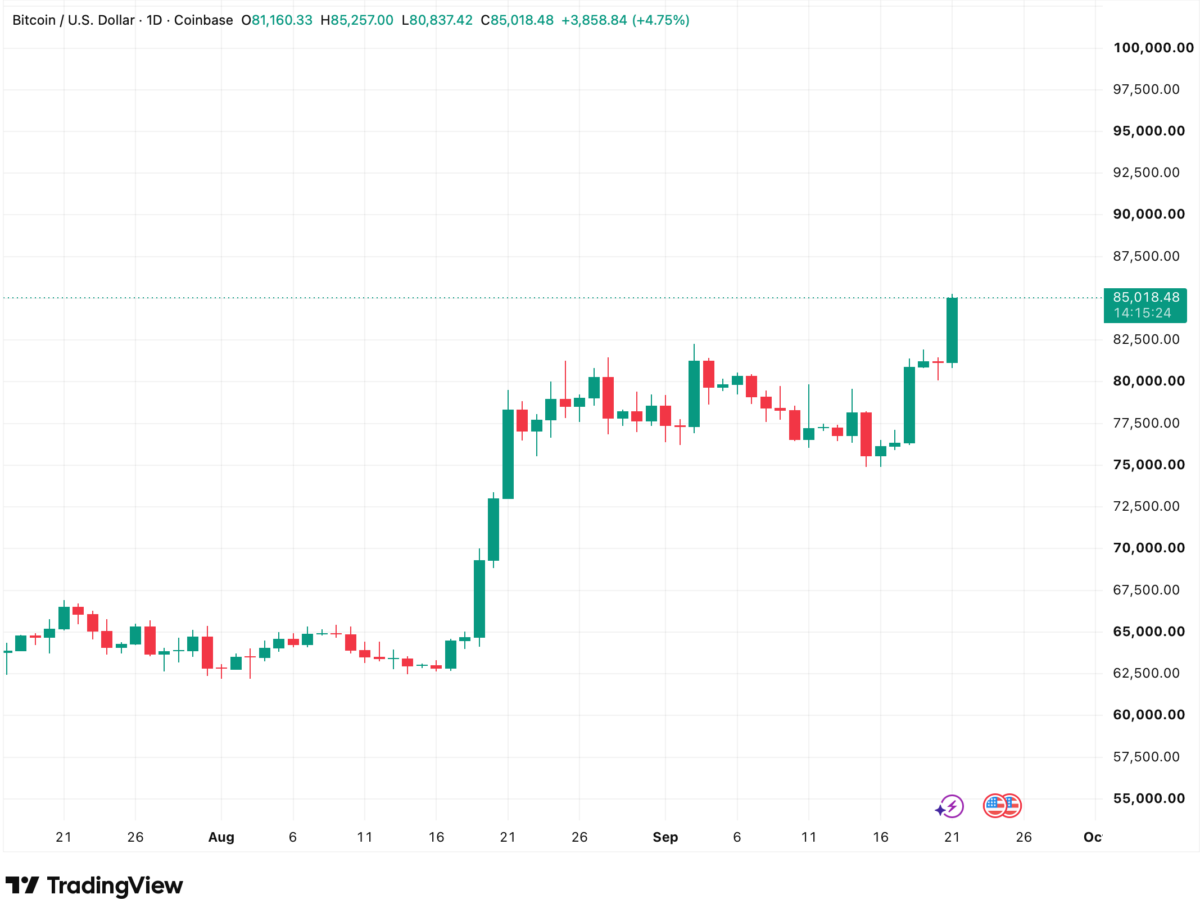
The breakout came after Bitcoin spent most of the previous month consolidating between approximately $75,000 and $82,000 following its August surge.
Derivatives positioning unwound rapidly as the upper boundary broke.
CoinGlass data in the market snapshot showed $598.92 million of positions liquidated over 24 hours, affecting 127,206 traders. Shorts represented $504.64 million of the total, meaning approximately 84 cents of every liquidation dollar came from bearish positions.
Bitcoin alone accounted for $275.33 million.
The shorter window was even more concentrated: $268.72 million of $285.42 million in four-hour liquidations came from shorts.
The data are consistent with forced short covering amplifying Bitcoin’s advance. They do not establish that liquidations caused the broader rally.
For a perpetual exchange, however, the important variable is the activity surrounding the move. Hyperliquid itself recorded approximately $35 million in liquidation volume over the latest 24 hours, according to DeFiLlama, alongside billions of dollars in daily perpetual trading.
Hyperliquid’s Revenue Now Has a Valuation Attached to It
$HYPE’s valuation provides a second quantitative test.
DeFiLlama currently places Hyperliquid’s circulating market capitalization around $20.3 billion, with annualized protocol revenue near $696 million.
On those figures, the circulating market capitalization is roughly 29 times annualized revenue.
The fully diluted comparison is much higher. With FDV around $87 billion, the ratio approaches 125 times annualized revenue.
These are not conventional price-to-sales multiples. Protocol revenue, token economics and shareholder revenue are not equivalent concepts, and future token supply materially changes the FDV calculation. They are better used as standardized reference points for tracking how the market values Hyperliquid relative to the economic activity it captures.
The revenue trend itself also deserves attention.
CoinGecko found that crypto projects averaged $1.08 billion in monthly revenue during January-August 2026, down 10.14% from the same eight months of 2025. Hyperliquid reached the top of the ranking despite that industry-wide decline.
That creates a more concrete set of metrics to follow after Bitcoin’s breakout: 30-day perpetual volume, revenue per dollar of volume, revenue relative to TVL and the valuation multiple attached to that revenue.
If volume retreats after the current liquidation wave while revenue efficiency holds, Hyperliquid’s lead would look less dependent on isolated volatility. If both fall sharply together, the $429 million year-to-date figure would tell a different story about the durability of its 2026 performance.