
Ethereum is pulling back, but the broader recovery setup remains intact if buyers defend the $1,742–$1,672 zone. A move back above $1,796–$1,844 could turn the July bounce into a stronger breakout toward $2,245.
Ethereum’s $1,800 Trigger Could Be the Breakout Bulls Need
Ethereum is pressing into a level that could decide whether this recovery keeps building or stalls again. If bulls can flip the $1,796–$1,816 area into support, the chart points to a stronger move toward $2,245.
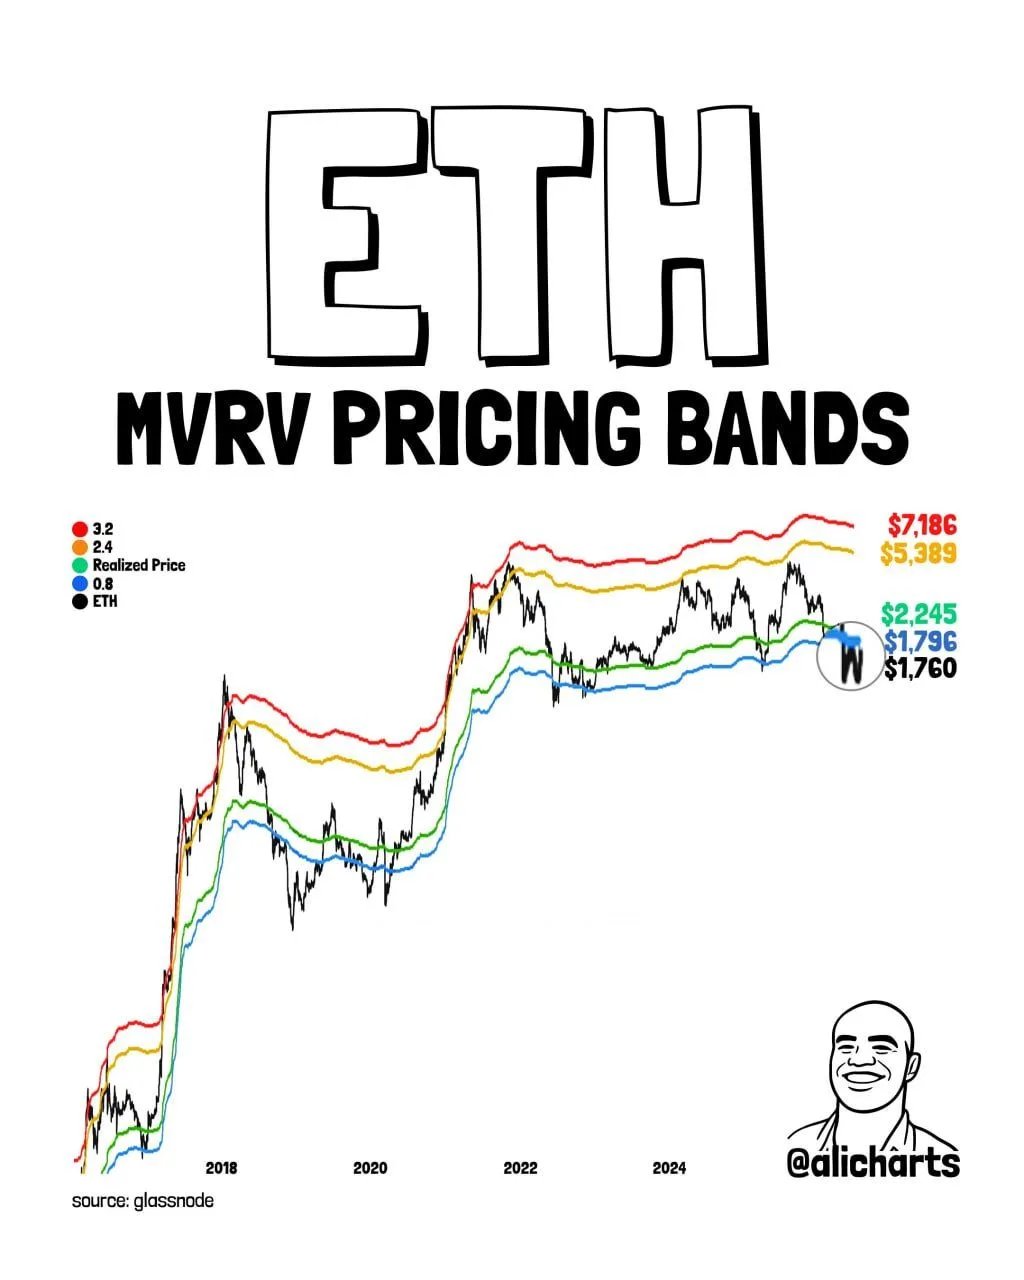
$ETH MVRV Pricing Bands chart. Source: Ali Charts on X, Glassnode.
Ethereum is testing the 0.8 MVRV Pricing Band near $1,796, which now stands out as the first major resistance level on the chart. According to Ali Charts, a daily close above that level, followed by a successful retest as support, would strengthen the bullish case.
That area matters because it lines up with more than one technical signal. Ali said the TD Sequential resistance trendline also sits around $1,796, while the TD risk line is slightly higher at $1,816. In other words, Ethereum is pressing into a tight resistance cluster rather than a single level.
If buyers clear both $1,796 and $1,816, the next level to watch is the top of the channel near $1,844. A breakout there would increase the odds of a larger push toward Ethereum’s Realized Price at $2,245, which is the main upside target in this setup.
The broader MVRV bands on the chart also show how important this zone is. The 0.8 band sits just above current price action, while the Realized Price near $2,245 marks the next major level if momentum improves.
Higher MVRV bands sit much further above, with the 2.4 band near $5,389 and the 3.2 band near $7,186. Those levels are not immediate targets, but they show where Ethereum could trade if a much stronger cycle expansion develops later.
For now, the setup is clear. Ethereum needs to reclaim $1,796, break $1,816, and then push through $1,844 to confirm a stronger bullish breakout. If that happens, the move toward $2,245 becomes much more realistic.
Ethereum Pullback Keeps July Recovery Setup Alive
Ethereum is moving through an expected wave 4 pullback, but the broader recovery structure remains intact for now. If buyers defend the retracement zone, $ETH could still attempt another push toward higher resistance later in July.
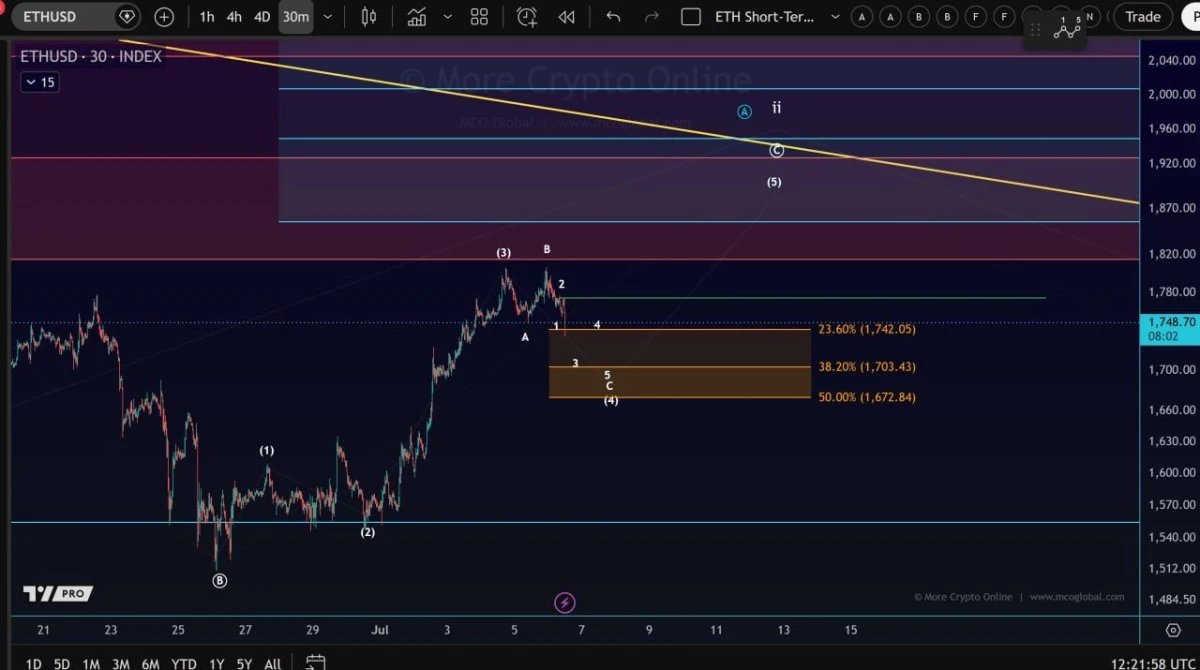
$ETH/USD 30-minute chart. Source: More Crypto Online on X, TradingView.
The chart shows $ETH pulling back after a strong short-term rally from the late-June lows.
According to More Crypto Online, this move fits the expected wave 4 correction inside the larger recovery setup. In Elliott Wave analysis, wave 4 is often a cooling phase before a possible final push higher.
The first support levels to watch sit near $1,742, $1,703, and $1,672. These are marked as retracement levels on the chart and could decide whether the bullish structure stays valid.
If $ETH holds this zone, the next upside move could target the higher resistance area between roughly $1,870 and $2,040. That zone includes the projected wave 5 area and broader overhead resistance.
However, the setup still needs buyers to defend the pullback. A clean break below the retracement zone would weaken the July recovery case and suggest the correction may need more time.
For now, the pullback looks controlled. Holding support would keep the bullish wave count alive, while losing it would put Ethereum’s short-term recovery back at risk. A recovery back above $1,800 would be the first sign that buyers are ready to challenge higher resistance again.