
Ethereum price hovered around $2,500 on Sep. 9 as buyers defended short-term support, but weakening momentum and negative capital flows kept a breakout above $2,535 out of reach.
Ethereum ($ETH) price traded near $2,486 at the time of writing on Sep. 9 after briefly rising above $2,520 earlier in the session. Price remained almost unchanged on the daily chart as buyers and sellers competed around the psychological $2,500 level.
The narrow move followed several days of consolidation after $ETH recovered from its early-September low near $2,430. Buyers have repeatedly stepped in around $2,478–$2,485, but each attempt to extend the recovery has met selling pressure between $2,525 and $2,535.
Spot Ethereum exchange-traded fund outflows have reduced one source of institutional demand during the consolidation. Broader risk appetite has also remained weak ahead of the Federal Reserve’s Sep. 15–16 policy meeting, while higher energy prices linked to the U.S.-Iran conflict have added to inflation concerns.
Regulatory uncertainty ahead of the expected U.S. Senate procedural vote on the Clarity Act on Sep. 15 has given institutional investors another reason to limit exposure. Ethereum has consequently struggled to separate from the wider risk-off tone across the crypto market.
Ethereum price momentum weakens below $2,500
The 4-hour chart shows $ETH trading at $2,486 after a rejection from an intraday high of $2,523. Price moved below the 20-period simple moving average at $2,490, placing buyers under immediate pressure.
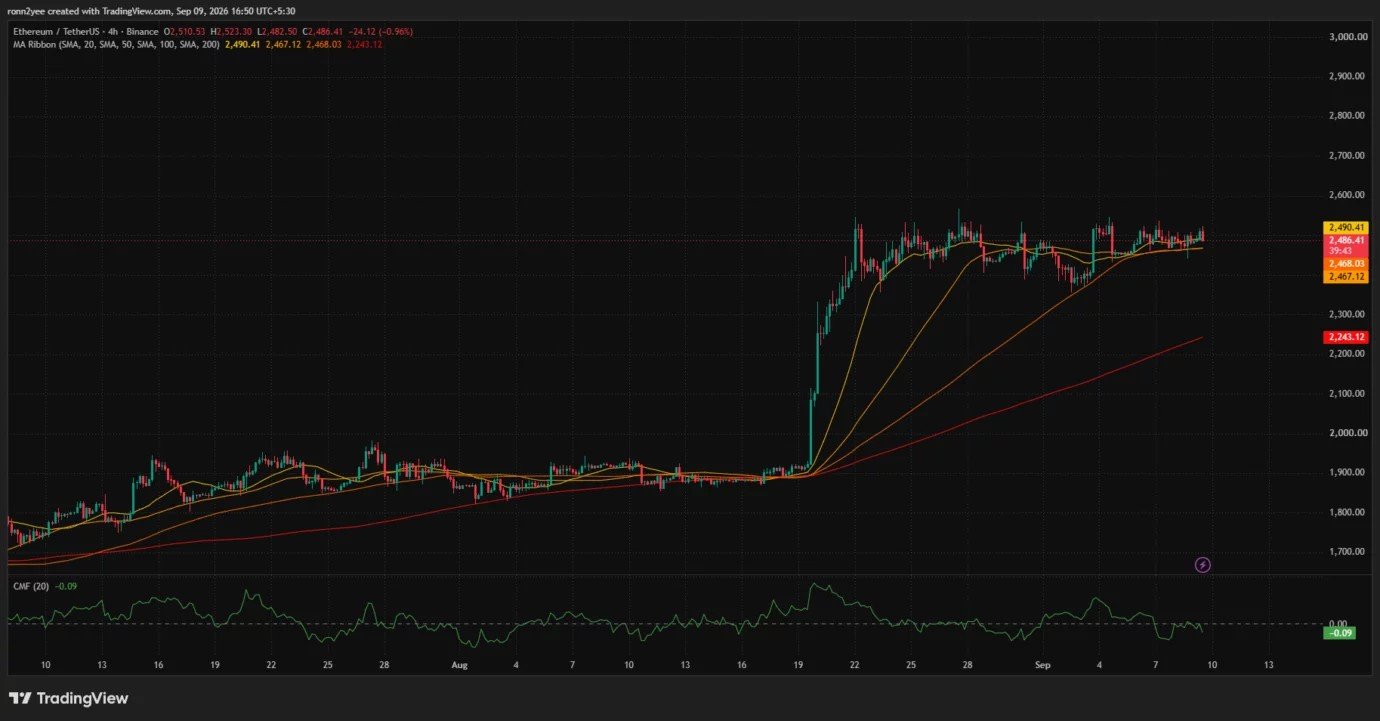
Ethereum remained above the 50-period and 100-period moving averages, located at $2,467 and $2,468, respectively. The close grouping of those averages creates an initial support zone between $2,465 and $2,470.
A break below the cluster would expose the recent range floor around $2,435–$2,445. Deeper selling could place the broader $2,350–$2,360 support zone back in focus, where the weekly liquidation heatmap shows the largest pool of downside liquidity.
The 200-period moving average remains much lower at $2,243, showing that $ETH’s medium-term structure has not broken despite its inability to clear nearby resistance.
Still, the Chaikin Money Flow reading of -0.09 points to net capital leaving the asset on the 4-hour timeframe. Continued negative CMF would make it harder for buyers to sustain a breakout, even if $ETH briefly returns above $2,500.
Daily momentum also warrants caution. The Awesome Oscillator remains positive at 239.44, but its contracting bars show that bullish momentum has cooled since the sharp August advance. $ETH is therefore consolidating below resistance rather than accelerating into a new upward leg.
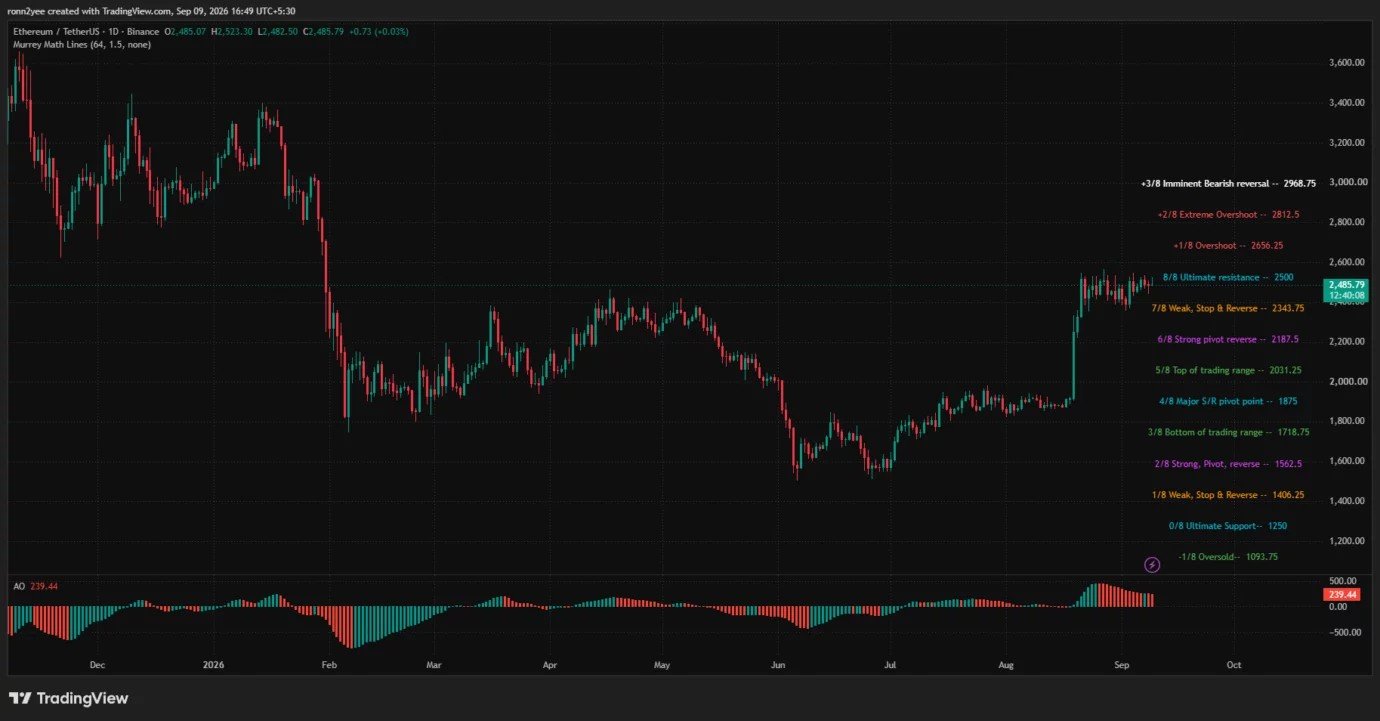
The daily chart places $2,500 at the Murrey Math 8/8 resistance level. A confirmed close above it would improve the immediate outlook, although buyers would still need to overcome repeated supply around $2,525–$2,535.
Market analyst Jules identified $2,478–$2,485 as the key short-term pivot and said repeated rebounds from the area showed active demand. However, the analyst warned that $ETH remained in compression until it closed above the resistance band.
“Both sides have clean levels. The longer this squeeze lasts, the more the eventual break will matter.”
According to Jules, a strong close through $2,525–$2,535 could clear the way toward $2,580–$2,600. Losing the pivot would instead weaken the setup and bring $2,435–$2,445 back into play.
Analyst Ted Pillows also identified $2,550 as a major resistance level. Pillows said a strong weekly close above the barrier could support an advance toward $3,000, although the current charts do not yet confirm such a breakout.
$ETH is moving towards the $2,550 resistance again.
— Ted (@TedPillows) September 9, 2026
One strong weekly close above this could push Ethereum to $3,000. pic.twitter.com/METZhCuZTK
Liquidation clusters could shape the next $ETH move
CoinGlass’s one-week liquidation heatmap shows leverage building on both sides of Ethereum’s current price.
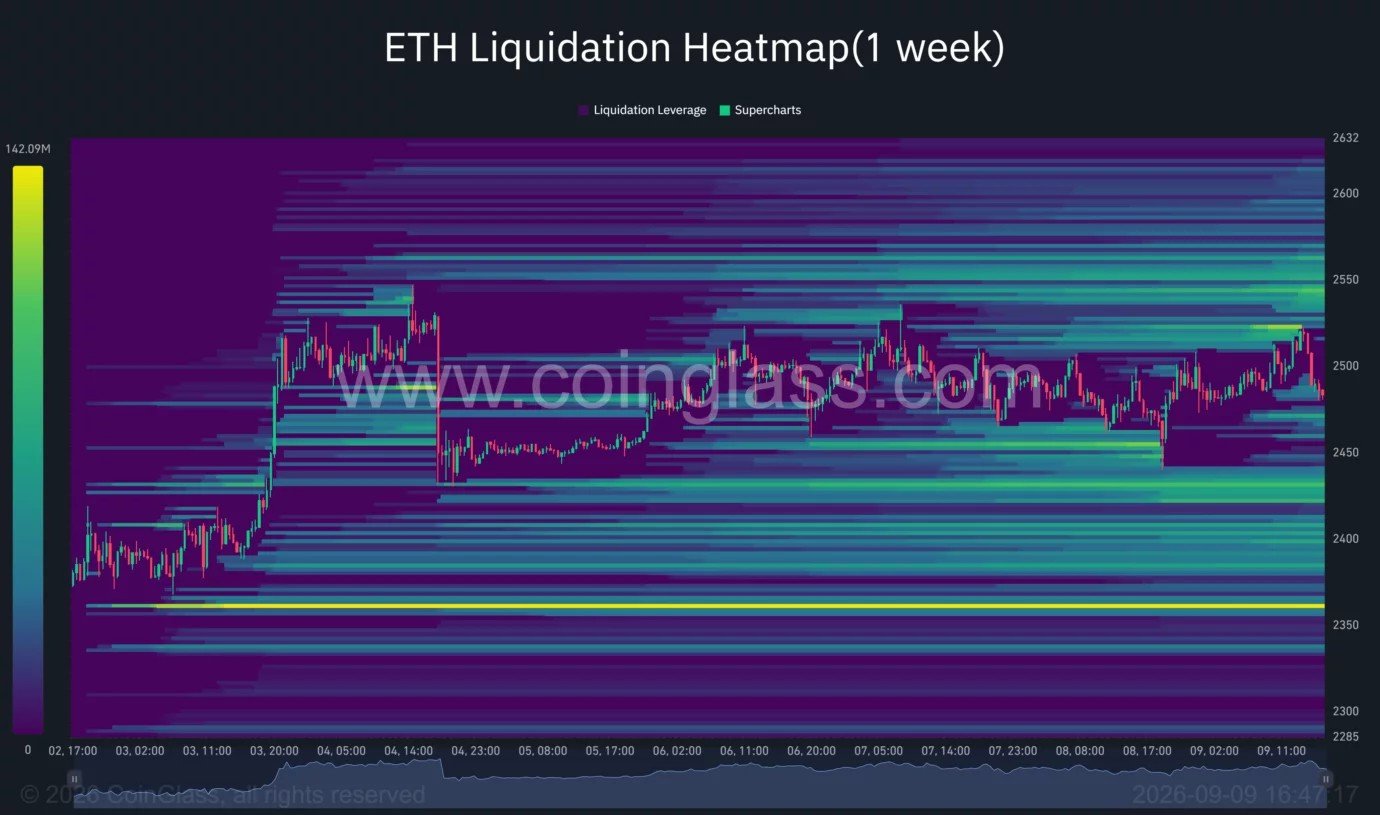
The closest large overhead clusters appear between $2,520 and $2,550. A move into the region could force short positions to close and provide additional momentum, but the same zone has repeatedly attracted spot selling.
More liquidation liquidity is visible between $2,580 and $2,610. Buyers would first need a sustained break above $2,535 and $2,550 before the upper cluster becomes a realistic target.
Downside liquidity is concentrated around $2,430, followed by a much larger band near $2,355–$2,365. A loss of $2,478 could pull price toward the first cluster, while a break below $2,430 would increase the probability of a deeper liquidity sweep.
Ethereum’s next directional move therefore depends on whether buyers can reclaim $2,500 and convert $2,525–$2,535 into support. Failure to do so would leave $ETH exposed to another test of $2,478, followed by $2,445 and $2,430. A daily close above $2,535 would strengthen the bullish case and place $2,550, $2,600, and eventually $3,000 on the upside map.