
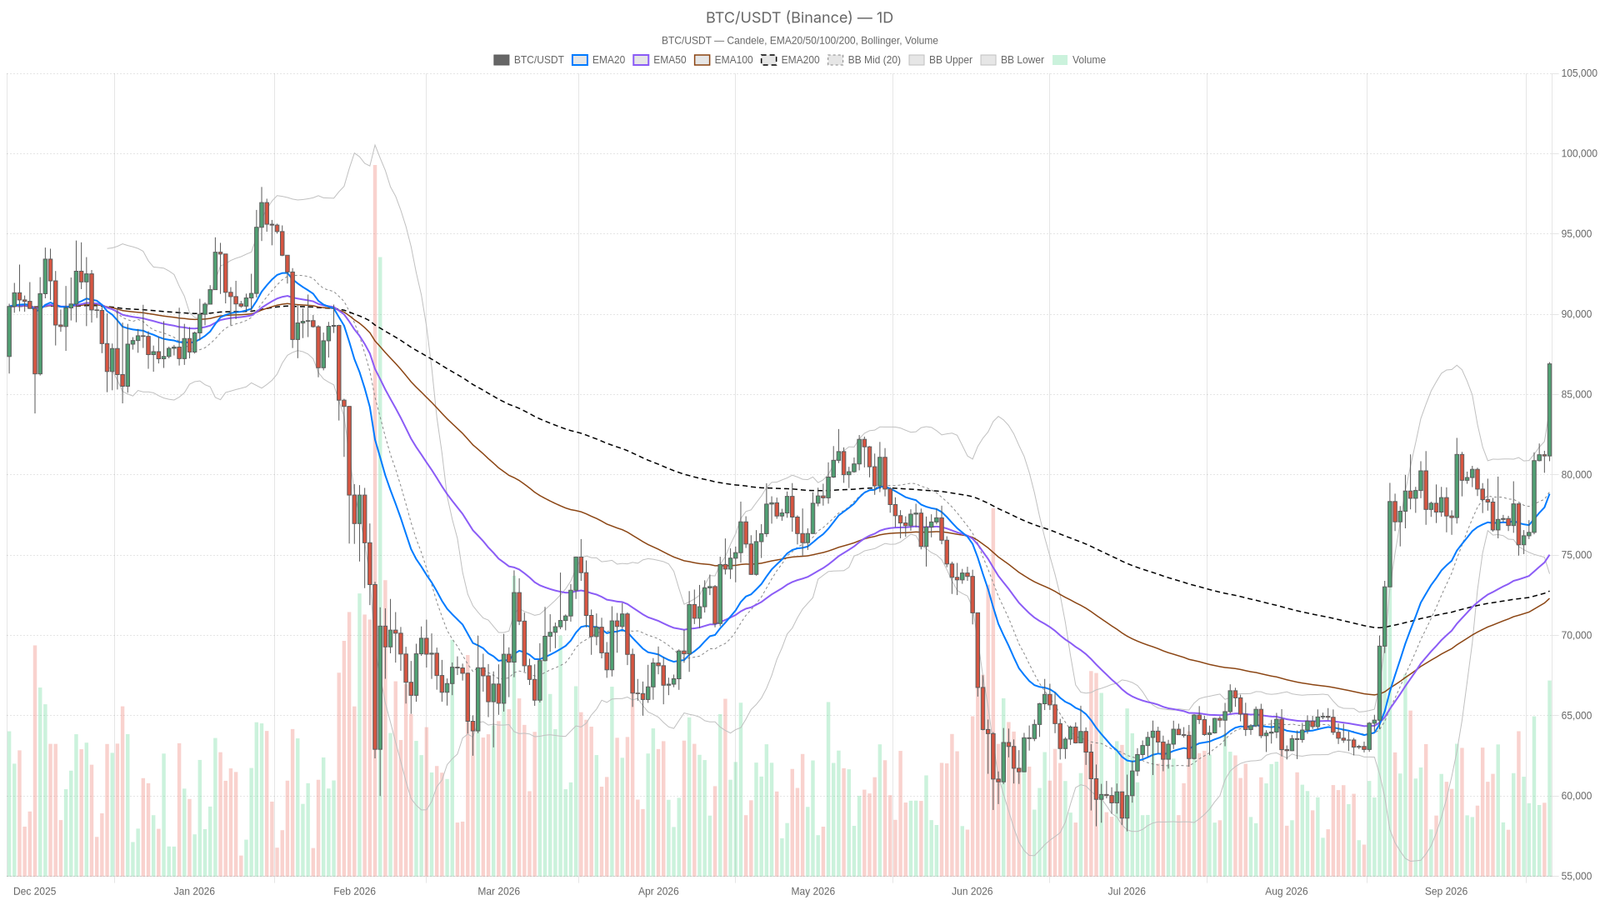
The crypto market cap climbed 3.48% in 24 hours to roughly $2.94 trillion, with Bitcoin dominance at 59%. $BTC price today is near $86,907 on the daily chart, just below recent highs after a sharp rally. The Fear & Greed Index sits at 70 in Greed territory.
Key takeaways
- Bitcoin trades near $86,907 with daily RSI14 at 74.27 in overbought territory.
- The 1H RSI14 has reached an extreme 87.84, signaling short-term exhaustion risk.
- Daily pivot resistance sits at $88,997.23, with key support at $82,833.87.
- Bitcoin dominance holds at 59% as total crypto market cap climbs to roughly $2.94 trillion.
- The Fear & Greed Index reads 70, firmly in Greed territory.
The backdrop as of September 21, 2026 matters here. A CNBC report citing VanEck suggests bitcoin is on track to hit a key level within the next year, with fiscal worries acting as a tailwind for the asset. Fortune’s price coverage from September 18 confirms bitcoin has been grinding higher into this stretch. Trend-following money is clearly in control, but the risk of a sharp mean-reversion snapback is building underneath the surface.
Daily Chart: Trend Is Bullish, but It’s Stretched
The daily trend remains unambiguously bullish, with price well above all major moving averages. Yet overbought signals on the RSI and Bollinger Bands suggest the move is now stretched. Price at $86,907 sits well above the EMA20 at $78,822, EMA50 at $75,025 and EMA200 at $72,763 — all three stacked in textbook bullish order. This is a market that has been trending for a while, not just spiking. The RSI14 at 74.27 confirms strong momentum but also sits deep in overbought territory.
Meanwhile, MACD backs up the bullish read: the line at 1991.2 sits comfortably above the signal at 1574.61, with a histogram of 416.59 that is still expanding. Momentum has not rolled over yet. The Bollinger Band setup is more telling — price is trading above the upper band at 84,054.81, with the mid-band all the way down at 78,945.5.
That said, this is a classic sign of an extended, possibly overheated move. Bands like this tend to either widen further on continuation or snap back hard once buyers exhaust themselves. Daily ATR14 of 2,436.36 shows volatility has picked up alongside the move, meaning swings in either direction will be larger than usual.
On the pivot grid, R1 sits at $88,997.23 and S1 at $82,833.87. That $82.8K level is the line in the sand for the bullish structure on the daily timeframe.
1H Timeframe: Momentum Confirms, but Exhaustion Risk Is Real
The 1-hour chart confirms bullish momentum, yet the RSI at 87.84 signals extreme overbought conditions that rarely sustain without at least a pause or pullback. The EMA20 at $84,555.65, EMA50 at $82,769.89 and EMA200 at $79,879.01 are all stacked bullishly and price is riding above them. However, the RSI14 at 87.84 is genuinely extreme. The daily trend is strong but not yet exhausted, while the 1H momentum is flashing a level that historically does not last long without a reaction.
MACD on the 1H — line at 1387.07 versus signal at 1189.95, histogram at 197.12 — remains positive, so momentum has not broken down. It is simply running hot. Moreover, price is pressing against the 1H upper Bollinger Band at $88,207.57, with the lower band all the way down at $79,957.93 — another sign of a stretched short-term move.
The tight 1H pivot range shows the market coiling in a narrow band right at the highs rather than pushing decisively through resistance. Pivot sits at $86,803.70, with R1 at just $87,117.28 and S1 at $86,593.81. This pattern often precedes either a breakout or a sharp rejection.
15-Minute View: Execution Context Only
The 15-minute chart shows consolidation rather than continuation — useful for timing entries and exits, not for building a directional thesis. Price at $86,910.16 is hugging its EMA20 at $86,114.23 and sitting above the upper Bollinger Band at $86,749.88. RSI14 reads 76.66 with a MACD histogram that has shrunk to just 23.81 — noticeably weaker than on the higher timeframes. That fading histogram does not invalidate the bullish structure, but it does suggest short-term buyers are losing steam at this level.
The Bullish Case
Bitcoin has a clear path higher if it breaks above $88,997.23 with conviction, supported by strong MACD momentum and concentrated capital flows into $BTC. The combination of positive MACD momentum, a 24-hour market cap gain of 3.48%, and 59% $BTC dominance suggests capital rotation could keep favoring bitcoin over altcoins in the near term. Broader sentiment tailwinds — including the fiscal-driven bullish case flagged by VanEck via CNBC — give this scenario a fundamental narrative to lean on.
However, this case gets invalidated if price fails to hold above the 1H EMA20 at $84,555.65 or breaks below the daily S1 at $82,833.87. That would signal the trend is losing its grip, not just pausing.
The Bearish Case
The bearish argument rests on exhaustion signals — extreme RSI readings and price stretched above Bollinger Bands on all timeframes often precede a mean-reversion move. An RSI of 87.84 on the 1H and price trading above the Bollinger upper bands on the daily and 15-minute timeframes are the kind of setup that often precedes a pullback. Such a move could target the daily EMA20 near $78,822.23 or the BB mid-band near $78,945.50.
That said, a pullback of that size would not break the broader bullish structure. It would, however, feel painful for anyone who bought the recent highs. This bearish scenario loses its footing if price holds above the 1H pivot support at $86,593.81 and the EMA20 on the hourly — that would suggest dips are being bought, keeping the uptrend intact.
Where This Leaves Traders
Traders should balance the bullish daily structure against short-term overbought warnings, sizing positions carefully given elevated ATR readings and the Greed-level sentiment. The daily trend and the 1H momentum are telling slightly different stories right now. The bigger picture is bullish and intact, but the shorter-term overbought readings mean the next move could just as easily be a shakeout as a breakout.
A Fear & Greed score of 70 has historically coincided with periods where volatility cuts both ways. Anyone positioning around $BTC price today should think in terms of scenarios and invalidation levels rather than certainties. This market is rewarding discipline over conviction alone, and the next few sessions should clarify whether the trend has more room to run or needs to cool off first.
FAQ
What is bitcoin’s current price?
As of September 21, 2026, bitcoin is trading near $86,907 on the daily chart, holding just below its most recent highs after a sharp rally that pushed the broader crypto market cap to roughly $2.94 trillion.
Is bitcoin overbought right now?
Yes, several indicators point to overbought conditions. The daily RSI14 sits at 74.27, while the 1H RSI14 has reached an extreme 87.84. Price is also trading above the upper Bollinger Bands on the daily and 15-minute timeframes analyzed.
What are the key support and resistance levels for bitcoin?
On the daily pivot grid, resistance sits at $88,997.23 (R1) and support at $82,833.87 (S1). On the 1H timeframe, the pivot is at $86,803.70 with tight R1 at $87,117.28 and S1 at $86,593.81.
Disclaimer: This article is for informational purposes only and does not constitute financial advice, an investment recommendation, or a solicitation to buy or sell any financial instrument or cryptocurrency. The analysis provided is not indicative of future results. Investing in crypto assets and financial markets carries a high risk of capital loss. Always do your own research (DYOR) and consult a qualified financial advisor before making any decision.
Article produced with the assistance of artificial intelligence and reviewed by the editorial team.