As of September 4, 2026, Avalanche price today reflects a market frozen at $7.50 — near the daily pivot point for $AVAX. That proximity signals indecision: bulls have short-term control, but the longer-term downtrend remains unbroken, leaving the next directional move hanging in the balance.
Key takeaways
- $AVAX sits at $7.50, near the daily pivot point of 7.49, signaling market indecision between recovery and continuation of the downtrend.
- The daily EMA200 at $8.43 remains the critical resistance level needed to confirm a genuine trend reversal.
- Pharaoh CL decentralized exchange fees surged over 1,150% on a 30-day basis, reflecting explosive on-chain activity on Avalanche.
- The Fear & Greed Index at 74 signals a risk-on environment that historically favors altcoin bids when technicals align.
- MACD histograms are negative on both daily and hourly timeframes, warning of fading momentum despite price holding near local highs.
What the Daily Chart Is Really Saying
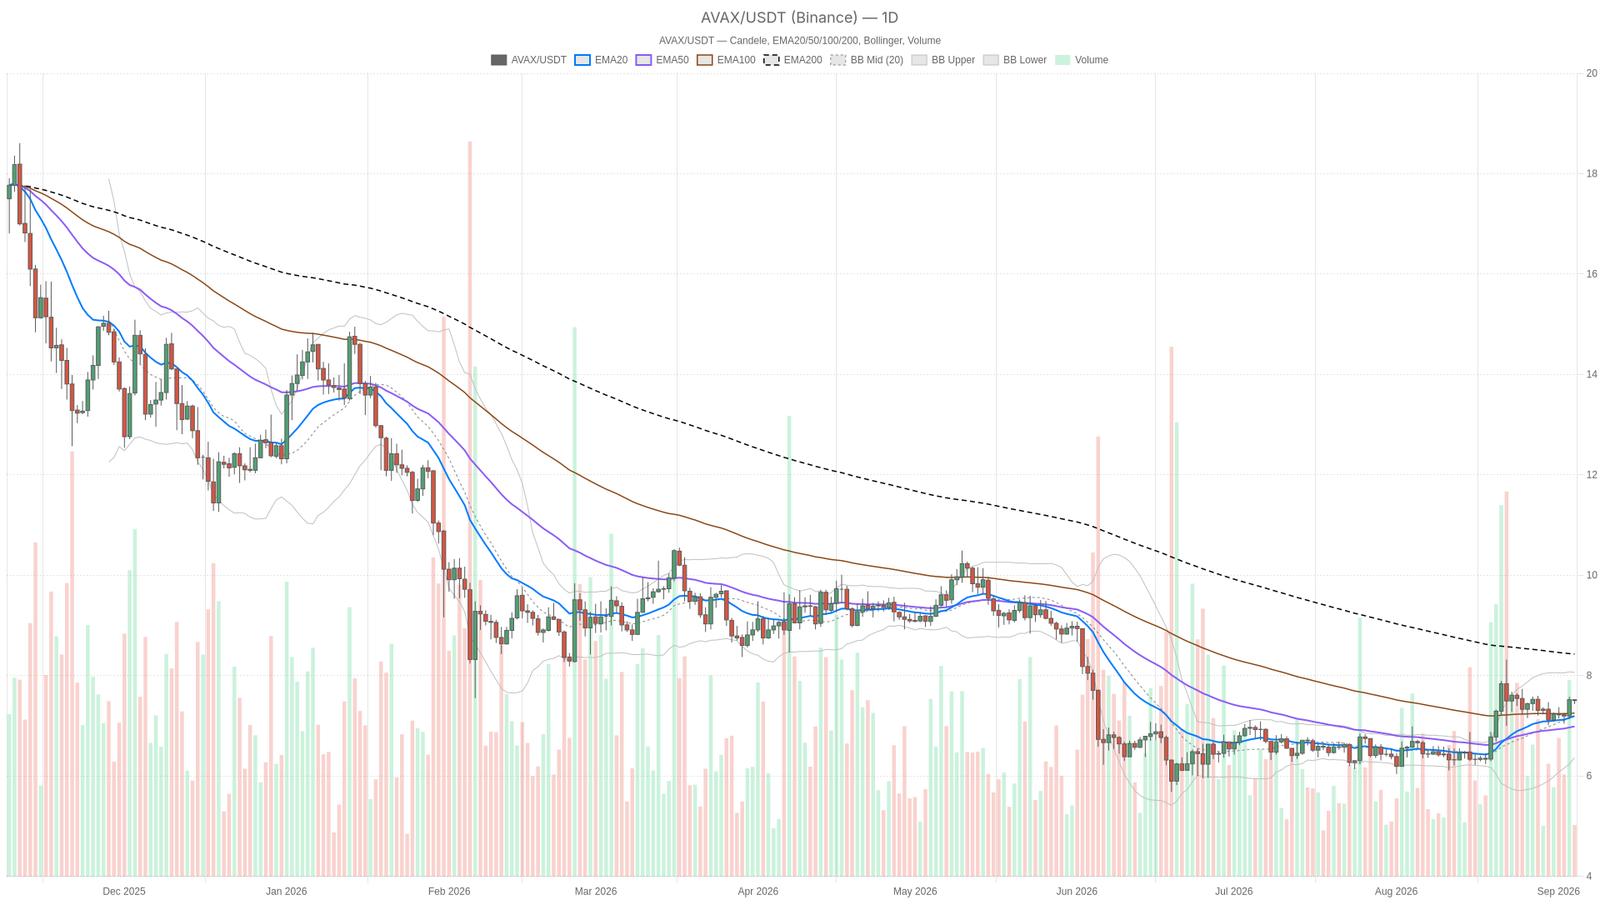
On the daily chart, the picture is genuinely mixed. $AVAX closes at $7.50, above both its EMA20 (7.19) and EMA50 (6.99) — a constructive short-to-medium-term signal that shows price climbing above its recent averages rather than drifting below them.
However, the EMA200 sits way up at $8.43, and until $AVAX closes back above that line, this remains a recovery inside a still-intact bear structure, not a confirmed trend reversal. The system labels the daily regime neutral, and that is the right read: momentum has improved, but the higher-timeframe trend has not flipped.
RSI14 on the daily stands at 60.66 — comfortably bullish without being stretched, leaving room for further upside. Meanwhile, MACD is more ambiguous: the line (0.19) is barely below the signal (0.20), and the histogram has slipped to -0.01. In plain terms, upward momentum is fading right as price approaches resistance. Bollinger Bands remain wide, with the midline at 7.21, the upper band at 8.06 and the lower at 6.37, while ATR14 at 0.37 confirms daily ranges are still large enough to produce real moves in either direction.
Hourly and 15-Minute Structure
Zooming into the 1-hour chart, the structure turns outright bullish. Price is stacked cleanly above the EMA20 (7.46), EMA50 (7.38) and EMA200 (7.33), and RSI14 at 62.27 backs that assessment with conviction.
That said, the MACD histogram here is also negative at -0.01, echoing the same soft momentum warning seen on the daily — the trend structure is bullish, but the fuel behind it is thinning. Moreover, Bollinger Bands on this timeframe have tightened notably (7.40 to 7.59), and ATR14 has compressed to just 0.05, signaling that volatility has been squeezed out of the hourly move. That compression often precedes a decisive directional push.
The 15-minute chart is where indecision becomes undeniable. EMAs are nearly stacked on top of each other, RSI has cooled to 55.14, and MACD is completely flat — line, signal and histogram all reading zero. Pivot levels on this timeframe sit barely apart, making it useful only for timing entries once the higher timeframes commit.
The Bullish Case
If $AVAX can hold above the daily pivot and push toward the daily EMA200 at $8.43, the recovery would gain real credibility. A clean break and hold above that level, ideally accompanied by MACD histograms turning positive across both daily and hourly timeframes, would confirm the recovery has staying power. Moreover, the risk-on backdrop gives this scenario real support. Greed sits at 74 and total crypto market cap is near $2.735 trillion, rising 1.89% over 24 hours. Additionally, Avalanche DEXs like Pharaoh V3 are posting strong fee growth, up 139.85% over 7 days. This bullish path gets invalidated if price fails to hold above the hourly EMA200 at 7.33.
The Bearish Case
The counter-argument sits right in the MACD histograms — negative on both daily and hourly despite price trading above short-term EMAs. This creates a subtle divergence: price is rising, but momentum is not fully confirming it. If $AVAX rejects at the pivot and slides back below the daily EMA50 at 6.99, the next real support zone becomes the lower Bollinger Band around $6.37. With the daily ATR at 0.37, that kind of move falls well within normal range. This bearish scenario is invalidated if $AVAX holds above 7.45 and momentum indicators flip positive again — at that point the divergence argument loses its teeth.
Where This Leaves Traders
Avalanche price today is a textbook case of conflicting signals resolving nothing yet: bullish hourly structure, a daily chart still under its 200-day EMA, and momentum indicators quietly fading even as price grinds higher. The DeFi fee data — particularly the explosive growth on Pharaoh’s pools and the volatile swings on Trader Joe’s V2.2, where fees rose 55.65% in a single day — adds a layer of fundamental interest. Still, on-chain fee spikes do not override chart structure on their own. Volatility compression on the hourly chart, with ATR down to 0.05, suggests a larger move is being coiled up. The direction will likely be decided at the daily EMA200 test above or the EMA50 test below. Given the Greed reading of 74 in the Fear & Greed Index, sentiment could amplify whichever direction wins that test. Traders watching $AVAX right now are essentially watching a coin at a decision point, and the sensible approach is to let price confirm direction through the daily pivot structure rather than anticipate it.
FAQ
What is the current $AVAX price?
As of September 4, 2026, $AVAX is trading at $7.50, sitting near the daily pivot point of 7.49, reflecting a market in equilibrium between buyers and sellers.
What are the key support and resistance levels for $AVAX?
Key resistance sits at the daily EMA200 of $8.43, while support rests at the daily EMA50 near $6.99 and the lower Bollinger Band around $6.37. On the hourly chart, the EMA200 at 7.33 serves as a critical line for the short-term bullish structure.
Is $AVAX currently in a bullish or bearish trend?
The daily chart shows a neutral structure. Shorter timeframes like the 1-hour are outright bullish, but the daily remains below the EMA200, keeping $AVAX within a longer-term bearish context until that level is reclaimed.
What on-chain signals are supporting $AVAX right now?
Decentralized exchange fees on Avalanche have surged significantly. Pharaoh CL fees jumped over 1,150% on a 30-day basis and 112.75% in the last 24 hours, while Trader Joe’s V2.2 pool saw fees rise 55.65% in a single day. Pharaoh V3 is also up 139.85% over 7 days, indicating strong network activity.
Disclaimer: This article is for informational purposes only and does not constitute financial advice, an investment recommendation, or a solicitation to buy or sell any financial instrument or cryptocurrency. The analysis provided is not indicative of future results. Investing in crypto assets and financial markets carries a high risk of capital loss. Always do your own research (DYOR) and consult a qualified financial advisor before making any decision.
Article produced with the assistance of artificial intelligence and reviewed by the editorial team.