
- Arbitrum price climbed 31%, hovering at the $0.11 mark.
- $ARB’s momentum reflects extreme buyer dominance.
Kicking off September 1, the new month begins with Arbitrum ($ARB) trading at around $0.1116, posting a 31.6% gain in value. Its daily volume is settled at $381.13 million. Moreover, the asset’s 24-hour session has ranged between $0.08477 and $0.1193.
Significantly, the Robinhood Chain, built on Arbitrum Orbit, has been live since July 8 and generated over $1.92 million in fees in a single 24-hour period. There is a massive jump from its average daily revenue of around $100,000.
Notably, 10% of net revenue flows back to the Arbitrum ecosystem; yesterday alone pushed approximately $190,000 directly into Arbitrum’s treasury. Also, the tokenised stocks on Arbitrum One have simultaneously hit a new all-time high of $200 million in market cap.
L2 projects had been widely written off, but Robinhood operating a dedicated Arbitrum chain successfully has reframed what Layer 2 infrastructure can actually deliver when a major platform commits to it seriously.
On the other hand, $ARB has touched its monthly resistance at current levels. Without a daily close above it, this risks being treated as an artificial pump rather than a structural breakout.
Can Arbitrum Build Enough Momentum to Sustain the Rally?
The four-hour price chart exhibits upside momentum, and if it breaks above the $0.1141 level, the trajectory could sustain. Assuming the bulls gain enough strength, they might initiate the formation of a golden cross, and the Arbitrum price would potentially climb and test the resistance near $0.1180.
In the case of the bullish sentiment fading, the bears would influence the asset’s price, and that could immediately slip to the support at $0.1101. Further correction on the downside would trigger $ARB’s death cross to take place. Gradually, the bearish pressure might pull back the price to its former low.
Zooming in on the technical chart of Arbitrum, the Moving Average Convergence Divergence (MACD) line is above the signal line, and both are trading above the zero line. It indicates strong bullish momentum and likely confirms an established uptrend. The buying momentum is still accelerating, and it is considered a high-conviction continuation signal for traders.
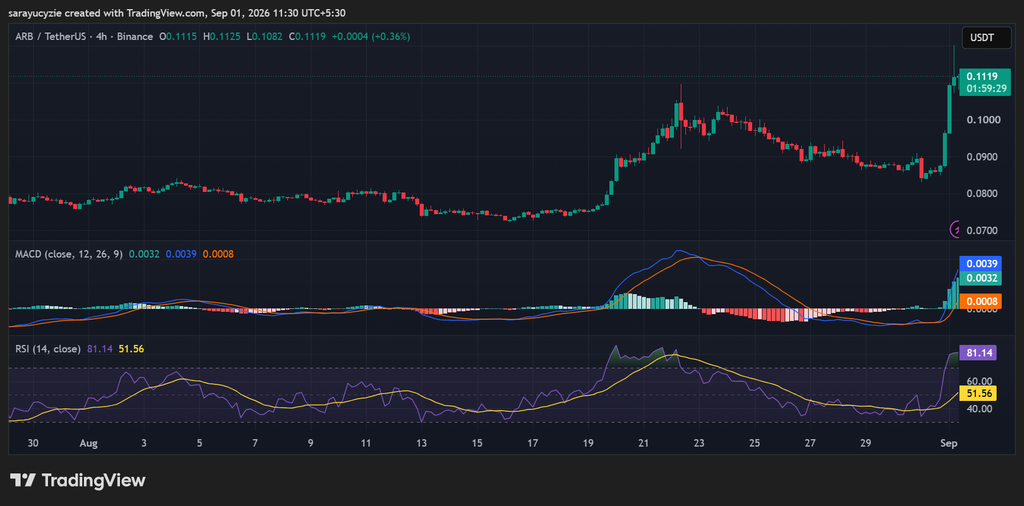
In addition, the current market condition of $ARB is in an extreme overbought zone, as the daily Relative Strength Index (RSI) stays at 81.14. This suggests an intense, vertical buying surge. The short-term price increase has been so aggressive that a consolidation becomes increasingly likely. It reflects extreme buyer dominance, but serves as a warning light rather than a buy signal.